The Opportunity Survey
Understanding the Roots of Attitudes on Inequality
Acknowledgments
The Opportunity Agenda wishes to thank and acknowledge the many people who contributed their time, energy, and expertise to the research and writing of this report. Our sincere gratitude goes to the leaders and experts in the field with whom we consulted as part of the advisory committee for this research: Terry Ao Minis, Dom Apollon, Lori Dorfman, Michael Fallig, Anika Fassia, Geoff Feinberg, Rachel Godsil, Jeremy Haile, Milly Hawk Daniel, Richard Kirsch, Tyler Lewis, Jeff Miller, Mee Moa, Jeffrey Parcher, Rob Santos, Jesse Van Tol, and Sean Thomas Butterfield.
This report was authored by Langer Research Associates. The report was edited by Eleni Delimpaltadaki Janis, Lisa Johns, and Melissa Moore at The Opportunity Agenda and designed by Content Inventions/Hot Pepper Studios. We want to express our great appreciation to Libby Johns who copyedited and Margo Harris who proofread the report. Special thanks to Eleni Delimpaltadaki Janis and researcher Lisa Johns who conceptualized this study and worked side by side with Langer Research Associates through the report’s completion.
The Opportunity Agenda’s research on perceptions of opportunity and causes of inequality is funded by The JPB Foundation, The Leadership Conference on Civil and Human Rights, The Libra Foundation, and the Open Society Foundations. The statements made and views expressed in this report are those of The Opportunity Agenda.
About The Opportunity Agenda
The Opportunity Agenda is a social justice communication lab. We collaborate with social justice leaders to move hearts and minds, driving lasting policy and culture change. We amplify the inspirational voice of opportunity through a combination of communication expertise, creative engagement and research.
Introduction
Opportunity is a deeply held value at the core of the American ethos. The belief that our nation can and should be a place where everyone has a fair chance to achieve his or her full potential is widely shared. But many believe the ideal of opportunity is in jeopardy and are willing to take steps to defend it.
In 2014, The Opportunity Agenda commissioned a groundbreaking nationwide survey to examine what the U.S. public thinks about opportunity in America and to measure public support for policies that expand opportunity across a range of issues, including jobs, education, criminal justice reform, immigration, and housing. Additionally, the research sought to gain a deeper understanding of the multiple factors that influence attitudes on inequality, contribute to an individual’s worldview, and predict people’s willingness to take action on issues they care about. Together, the survey’s findings offer critical insights for social justice leaders and organizations seeking to move hearts, minds, and policy.
Methodology
Administered by Langer Research Associates, the Opportunity Survey was conducted between February 4 and March 10, 2014, among a random national sample of 2,055 respondents. The survey oversampled very low-income adults (those living below 50 percent of the federal poverty line), African American men, and Asian Americans—groups whose voices are frequently overlooked in opinion polling. And it includes a special analysis of the views of the rising American electorate—millennials, people of color, and unmarried women—who have increasingly greater sway in elections. Respondents whose first language is Spanish had the option to take the survey in that language. The research also includes a cluster analysis that identifies the demographic characteristics, personal experience, values, and core beliefs that predict support for social justice policies and motivate people to action.
Findings
The survey’s findings paint a rich picture of a nation yearning for greater opportunity and increasingly interested in fundamental social change toward that end. Findings include:
Inside you’ll find:
- Profiles of those most
likely to be activated - Details about how support
for social justice issues is
related to attitudes,
personal experiences, and
values - Insight into views on
poverty, housing, criminal
justice, immigration, public
institutions, and more
- A whopping nine in 10 Americans see discrimination against one or more groups as a serious problem, and over 60 percent believe inequality of opportunity is unacceptable.
- A majority of Americans now have direct experience with discrimination; six in 10 say that they have personally experienced unequal treatment based on race, ethnicity, economic status, sexual orientation, gender, religious beliefs, or accent.
- Those who have experienced discrimination are more likely to view inequitable treatment as a serious problem in our country and are more willing to take action to improve opportunities for various groups.
- The vast majority of Americans are open to major change. Seventy-one percent believe that trying new ways of doing things, rather than maintaining tradition, is more important.
- There is a robust pattern of cross-issue support for opportunity-expanding solutions, indicating the potential for broad coalitions and voting blocs that transcend specific policy debates.
- Particular life experiences and values predict willingness to take action on behalf of groups or on specific issues. These include frequency of contact with members of other groups, the perceived seriousness of unequal treatment, a sense of personal and group efficacy, and personal experience of unfair treatment based on group identity.
Implications
Every couple of generations, national values, demographic change, attitudes, and experiences converge to create the potential for transformative social change. Taken together, this survey’s findings indicate a profound public openness to addressing the challenges that perpetuate inequality.
In an era of increasing social activism on issues ranging from fair wages to racial profiling to immigration to LGBT equality, the Opportunity Survey offers critical information and analysis to those pursuing social justice across our nation. Its findings offer new insights for engaging vast new audiences while activating the base of existing supporters.
Executive Summary
Nine in 10 Americans see discrimination against one or more groups in U.S. society as a serious problem, while far fewer say government programs to deal with it are successful. Potential support for greater efforts thus exists—but only within a matrix of values, experiences, and priorities that forms the basis of perceptions of inequality and willingness to address it.
The Opportunity Survey1 pulls apart those strands, measuring not only public attitudes about inequality and related policies but also the basic orientations that influence those views. Beyond customary political and ideological preferences, these include more fundamental values and beliefs that inform views of society and social policy.
1. This report is based on a national survey of 2,055 adults produced for The Opportunity Agenda by Langer Research Associates of New York, N.Y., an independent, nonpartisan research company specializing in survey design, management, and analysis. Field work was conducted via the randomly recruited, nationally representative GfK KnowledgePanel®.
Current Attitudes
The national survey, sponsored by The Opportunity Agenda, finds that the public sees discrimination most keenly as it affects low-income adults, with 75 percent calling unequal treatment of the poor a very or somewhat serious problem in U.S. society. Next is discrimination against formerly incarcerated people, undocumented immigrants, black men, Native Americans, black women, and gays or lesbians, with 55 to 60 percent calling each of these a serious problem.
As noted, a total of nine in 10 see unfair treatment of one or more of these groups as a serious problem, a nearly unanimous judgment. At the same time, just 41 percent think that government programs designed to prevent discrimination are effective, with a mere 4 percent saying they’re working “very” well.
Further, six in 10 Americans say they personally have experienced at least one of the various types of unfair treatment tested in this survey—that is, on the basis of their financial situation, gender, race and ethnicity, sexual orientation, language ability, or religion. This experience is a strong predictor of sensitivity to the issue.
Views on social policies, for their part, share a starting point of extensive public dissatisfaction with the status quo. Anywhere from 69 to 81 percent of Americans see a need for either major improvements or a complete redesign of the U.S. criminal justice system, economic system, public education system, and/or the political system overall.
But there are differences—and sometimes conflicted attitudes—on what reform might look like. By 54 to 46 percent, for example, Americans divide on whether the criminal justice system would do better by focusing on stricter punishment for people convicted of crimes or on greater efforts to rehabilitate them. Yet, post-punishment, two-thirds support increased spending on job training and placement programs for people who have served a prison sentence, and majorities, 55 and 56 percent, respectively, support tax incentives for employers to hire formerly incarcerated people and laws restricting discrimination in hiring against such individuals.
Another criminal justice issue has a highly lopsided result: An overwhelming 86 percent say police officers should not be permitted to stop and search people solely because of their race or ethnicity, with most favoring system-wide training programs, rather than individual officer-level retraining, to ensure that this does not occur.
In terms of housing discrimination, two groups, people who formerly have been imprisoned and undocumented immigrants, are most apt to be perceived as victimized. However, just three in 10 adults see housing discrimination laws as “too weak,” suggesting that the challenge in terms of housing is seen as one of enforcement rather than legislation.
There is substantial support, at the same time, for legislation to address the status of undocumented immigrants living in the United States. Fifty-six percent of Americans support a “path to citizenship” for these individuals—and this grows sharply, to 83 percent, if they first pay a fine, pay back taxes, learn English, and pass background checks.
The survey finds Americans most disposed to take action to assist two groups in particular—women and the poor—with more than six in 10 saying they’d be willing to work to improve opportunities for these groups (or already do so). About half as many, 31 and 32 percent, respectively, express willingness to help undocumented immigrants or formerly incarcerated individuals. Willingness to help other groups—Native Americans, black women and black men, Latinos, gays and lesbians, and Asian Americans—falls in between these extremes.
In terms of taking action on the basis of issues, rather than groups, reducing poverty receives the most interest, followed by encouraging equal opportunity for all, with two-thirds or more willing to act (or already doing so). Fewer than half, in contrast, are motivated to help seek fair treatment of minorities in the criminal justice system, secure the U.S. border with Mexico, or provide a path to citizenship for undocumented immigrants.
Willingness to engage in specific actions to support an issue or group shows broader openness toward behaviors that require less commitment. Two-thirds are willing to talk to others they know about their views (including 8 percent who already do so), and 62 percent say they would sign a petition (or have done so). Far fewer are willing to engage in more public, committing behaviors to further a cause, such as writing something to motivate others, participating in a creative project, or taking part in a protest or demonstration.
Core Values and Key Predictors
The public differs on the causes of inequality. Americans are most apt to feel that unfair treatment of women and Native Americans reflects conditions in society, rather than these groups’ own behavior. They’re least apt to feel that way about formerly incarcerated people, with other groups between these poles.
The Opportunity Survey finds that basic values and perceptions of society play into these views and in many cases are triggers for concern about discrimination, issue support, and willingness to act. Among them:
- Eighty-five percent of Americans think society works better when all have an equal chance at success, with 57 percent feeling that way strongly. Sixty-three percent, moreover, see inequality of opportunity in general as unacceptable.
- Just 37 percent say that society currently offers equal opportunities to most or all groups, while a similar number, four in 10, say just some or only a few groups have an equal chance to succeed. (The rest, 25%, take the middle position, saying “a good number” have equal opportunities.)
- Seven in 10 are open to new ways of doing things, vs. three in 10 who prefer to stick to traditional approaches—a result that suggests significant potential room for acceptance of innovation when it comes to addressing social problems, if tailored to other preferences.
- Just a quarter of adults believe they personally have substantial ability to effect change on social issues they care about; 37 percent feel they have “some” such ability, while four in 10 say they have only limited ability to bring about change. This sense of efficacy predicts willingness to take action on behalf of groups or issues.
With these as starting points, the survey adds insight into where America stands on opportunity issues—and why. Section I of this report documents the current attitudes described above. Section II looks at core values, perceptions of society, and group identities. Drawn from tenets of social psychology (see Appendix A), this analysis adds the overlay of personal experiences and the relationship of these factors to views on discrimination. The first half of Section III then examines common predictors of support for policies to address social issues and willingness to take action on them.
These sections include results of statistical modeling (detailed in Appendix D) produced to tease out the strongest independent predictors of concern about discrimination. Results underscore the role of basic values, social orientations, and personal experience in the attitudes of interest.
In one example, seeing unequal treatment of various groups as a serious problem is strongly predicted by political ideology but also by even more basic views. Those additional predictors include:
- Attitudes on the acceptability of unequal treatment
- Whether prosperity is seen chiefly as linked among people or the result of individual effort
- Personal experience of unfair treatment because of group membership
- Traditionalism
- Whether group behavior or social conditions are perceived as more responsible for inequality
- The extent to which individuals strongly identify with the groups to which they belong
Prioritizing values such as loyalty, authority, or honor, meanwhile, relates to diminished concern about unequal treatment.
Many of these same variables also predict perceptions of housing discrimination and support for policies to alleviate poverty, to reform the criminal justice system, and to provide a path to citizenship for undocumented immigrants. Understanding the predictors of these attitudes provides useful insights into policy formation and public motivation alike.
Moving from attitudes to action, the statistical modeling results also predict willingness to become personally involved on behalf of various groups. Some of the same predictors emerge, as do others. Predictors of willingness to take action on behalf of groups, or on specific issues, include:
- Frequency of contact with members of other groups
- Perceived seriousness of unequal treatment
- Personal and group efficacy
- Personal experience of unfair treatment as a group member
Recognizing these triggers to citizen involvement adds another layer of actionable information to the Opportunity Survey’s findings.
The results also show that people who see discrimination against one group as a serious problem are more likely to say the same about unequal treatment of other groups—demonstrating that this view is not a simple matter of self-interest or single-group sensitivity, but rather an expression of a broader core belief.
Cluster Analysis
As a next step in understanding motivations to act on social issues, the Opportunity Survey identifies segments of the U.S. population on the basis of their views on discrimination, their personal experiences with it, and their willingness to take steps to address inequality. Six typologies emerge, with differing demographic characteristics, policy views, and core values, as follows:
- Core catalysts, 19 percent of the adult population of the United States, are those most committed to advancing equal opportunity. Including disproportionate numbers of racial and ethnic minorities and political liberals and slightly more women than average—especially unmarried women—members of this group are the most likely to have experienced unfair treatment personally, to think it’s a serious problem, and to be willing to act to address it. They have strong in-group identities, eschew tradition, reject notions of inherent superiority, and are more apt than others to see people’s prosperity as linked rather than as individual outcomes. They’re also more confident they can bring about change, a precursor to taking action.
- Potential advocates, 18 percent of adults, are less apt than core catalysts to have experienced unequal treatment but are highly attuned to it nonetheless. Including many white liberals, members of this group broadly support an active social policy agenda, rank “equal treatment” prominently as a value, and are more likely than average to attribute inequality to social conditions rather than to group behaviors. Yet they’re among the least apt to have strong in-group identities of their own and much less inclined than core catalysts to believe they personally, or groups generally, can bring about change.
- Ambivalents, 22 percent of the population, are conflicted. Many perceive inequality of opportunity, support policies intended to address it, and think it’s better when everyone has an equal chance. But they also hold some core values—including traditionalism, individualism, and a stress on acting honorably—that militate against activism. They’re the oldest of the six groups on average, with numerically the highest share of women.
- The disengaged, 14 percent overall, include more men, especially more unmarried men, than any other group. They’re generally comfortable with the status quo and uninvolved politically, with limited personal experience of discrimination and the least personal efficacy of any group. Eight in 10 think individuals are responsible for their own success, six in 10 say some groups are more intelligent than others, and they’re far below average in their willingness to take action to help the disadvantaged.
- Skeptics, 17 percent of adults, are not inclined to support policy initiatives on opportunity issues, although not adamantly opposed. They’re below average in their perceptions of the extent and seriousness of inequality among groups, slightly more apt than average to think it’s caused by group behaviors rather than by social conditions, and less likely than average to have personally experienced unfair treatment. They lean toward a conservative orientation and away from the Democratic Party.
- Resistants, the final 10 percent, express ideological opposition to social policies intended to address inequality. Overwhelmingly conservative politically and more apt than others to be Republican, they include more married men and fewer unmarried women than any other group. Half see inequality of opportunity as at least somewhat acceptable; regardless, six in 10 think equality is generally available, a view far less prevalent among others. Individualism, meritocracy, honor, and tradition are core values.
These typologies are evaluated in greater detail in Section III of this report. Section IV goes on to examine some groups of additional interest, describing values and attitudes among very low-income adults, black men, and three groups that have received attention in terms of their political impact—nonwhites overall, unmarried women, and millennials (adults younger than age 30). Appendices include a review of the relevant social psychology literature, the survey’s topline results, methodology, details of statistical modeling, and references.
Understanding the roots of public opinion on inequality and social issues is key to working with it. Whether the aim is policy formation, communication, or motivation, strategies are best targeted when they take into account underlying predispositions and independent predictors of attitudes and propensity to act. The Opportunity Survey points clearly in those directions.
01. Social Issue Attitudes, Support, and Action
Perceptions of inequality are widespread in the United States: A vast nine in 10 Americans in the Opportunity Survey see unfair treatment of at least one minority group as a serious problem. This report examines the extent of those concerns, their sources, and the public’s willingness to take action to address opportunity issues.
Leading the list by a wide margin, 75 percent of the public views unequal treatment of poor people as a serious problem, including 35 percent who see it as “very” serious. Fifty-two to 60 percent see a serious problem in unequal treatment of eight other groups tested, including people who have served a prison sentence, undocumented immigrants, black men, black women, Native Americans, gays and lesbians, women overall, and Latinos.
Not surprisingly, members of a specific group are substantially more likely than others to regard unequal treatment of their own group as a serious concern. Eighty-three percent of black women and 79 percent of black men see discrimination against their groups as serious; just 54 and 56 percent of non-black women and men share those views. Asian Americans, non-heterosexuals, women overall, and Latinos all are more likely than non-group members—by double-digit margins—to view disadvantageous treatment of their groups as a serious problem.
The source of these views is a key insight. The survey reveals four important predictors of seeing discrimination against groups as a serious problem: the extent to which people see group-based inequality as unacceptable, belief in “linked fate” (i.e., the notion that the prosperity of one is linked to the prosperity of all), personal experiences with unfair treatment, and the importance of group membership in one’s self-identity. (See Section II for more on these views and Section III for details of the statistical modeling used in this analysis.) Concern about inequality thus relies in part on feelings that it’s incompatible with American society and damaging to broader well-being.
Other predictors also are informative. Perceived seriousness of unequal treatment is less strong among those with a greater preference for tradition in general and traditional morality in particular; among people who perceive basic systems of American society as fair; and among those who prioritize loyalty, respect for authority, and behaving honorably. Increased concern may then rest on the notion that discrimination violates traditional values of liberty, fairness, and equal opportunity.
Public Institutions and Government Efforts
While views of inequality are substantial, a related concern—discontent with public institutions—is rife. Eight in 10 adults say the U.S. political system needs major improvements, including three in 10 who feel it ought to be redesigned entirely. Views of the economic, educational, and criminal justice systems are almost as negative, with seven in 10 to three-quarters saying each needs major change. Fewer than 5 percent feel that any of these is “as good as it can be.”
People who are more likely to see these systems as needing improvement also are more likely to express opportunity-related concerns—that is, to see unequal treatment of groups as a serious problem, to see housing discrimination as prevalent, and to support measures to address poverty and related issues.
Views of the success of the government’s attempts to reduce discrimination are tepid, at best. Only four in 10 Americans think government programs to reduce discrimination are working well overall, including just 4 percent who think they’re working very well. Six in 10 see such programs as largely ineffective, including 16 percent who call them completely unsuccessful.
These perceptions are another important element of support for opportunity policies. In statistical modeling, seeing government programs as effective independently predicts support for a range of initiatives, including anti-poverty efforts and criminal justice and immigration reforms.
Anti-poverty Programs and Policies
In terms of funding, the survey finds a division between preferences to maintain or to increase spending on four poverty-related government programs, with little constituency for cuts—albeit with sizable program-specific and group-based differences.
Spending on college loan and student lunch programs wins the most support (both in line with the public’s priority on improving education, covered below): Forty-seven percent of Americans think funding for college loan programs should be increased, and 43 percent think it should be held steady; it’s a similar 44 and 48 percent for school lunch programs. Just 10 and 8 percent, respectively, advocate cutbacks.
There’s slightly more support for cutting back on the two other items tested, food stamps and unemployment benefits, but it’s still only about 20 percent. Forty-seven and 53 percent, respectively, favor keeping spending levels on these the same; three in 10 would spend more.
Political partisanship sharply divides these views. Averaged across the four items, Democrats are 32 percentage points more likely than Republicans to support increased spending. There also are double-digit differences between racial and ethnic groups, with blacks and Latinos more apt than whites and Asian Americans to favor higher spending on these programs.
When it comes to Americans’ priorities for various social policies intended to reduce poverty, improving public education leads the way; more than three-quarters say it should be a high priority for public policy, including 45 percent who think it should be a “very” high priority. That’s followed by some bread-and-butter items: avoiding cutbacks to Social Security, cited as a priority by 65 percent; holding down interest rates on student loans, by 62 percent; and raising the minimum wage, by 52 percent.
Three other areas are given somewhat lower priority: Forty-five, 44, and 43 percent say high priority should be given to expanding government funded job-training programs, increasing spending on infrastructure, and cutting business taxes to encourage job creation, respectively.
Again there’s substantial political partisanship on these issues, especially views of the minimum wage, job training, and infrastructure spending. Democrats are more apt to favor each of the policies tested, save one—cutting business taxes to encourage job growth.
Key predictors of prioritizing anti-poverty programs—and increasing their funding—have implications for framing these issues. The most important predictor, by far, is seeing unequal treatment of poor people as a serious problem. That’s followed by the importance of group identification, seeing group inequalities as unacceptable, frequency of personal contact with diverse group members, attributing inequality to societal factors rather than to group members’ own behavior, and seeing government programs to reduce discrimination as effective.
Housing Discrimination
Housing discrimination provides a specific example of more general views on opportunity: Again, a vast majority of Americans, 83 percent, believe that one or more groups face substantial bias when trying to buy or rent a home or apartment.
Such perceptions depend on the group in question. Seven in 10 adults feel that people who have served a prison sentence experience discrimination when they try to buy or rent a home, and 64 percent say the same of undocumented immigrants. Across the spectrum, just 15 and 16 percent, respectively, say the same about Asian Americans and women.
Other groups fall in the middle. Housing bias against Muslims is seen by 47 percent, against gays and lesbians by 40 percent, against blacks by 38 percent, against people with disabilities by 36 percent, and against Latinos by a third. Roughly a quarter see discrimination in housing against Native Americans and single parents.
Perceptions of housing discrimination against one’s own group are highest among blacks, especially black women, and lowest among whites and Asian Americans. For example, 69 percent of black women perceive either a great deal or a substantial amount of housing discrimination against blacks, whereas just 15 percent of Asian Americans think Asian Americans experience discrimination when trying to obtain housing.
Given the overall level of concern, support for existing laws designed to prevent housing bias is broad. Just one in 10 says such laws are too strong; six in 10 think they’re about right, and three in 10 say they’re too weak. Among blacks, however, six in 10 say such laws are too weak.
As with other spending, the survey finds a division on whether programs intended to boost home ownership and construction of affordable housing should be expanded or maintained as they are now but finds very little support for reducing them. Forty-six and 44 percent, respectively, support maintaining current policies on the tax deductibility of mortgage interest payments and tax enticements to encourage development of affordable housing. Forty-three and 42 percent, respectively, say they should be expanded. Only about one in 10 favors cutting these back.
The Criminal Justice System
While a large majority of Americans see flaws in the current criminal justice system, the public divides on one question at the core of reform—whether to focus on stricter punishment for people convicted of crimes, favored by 54 percent, or greater rehabilitation efforts, supported by 46 percent. “Strong” sentiment favors stricter punishment by a 14-point margin, 37 vs. 23 percent.
Americans also are split on expanding or maintaining alternative sentencing programs for those convicted of nonviolent crimes, i.e., offering probation, treatment, counseling, and payment of damages instead of prison time. About half think such programs should be increased; 43 percent think they should be kept about the same; and just 9 percent favor cutting them back. (These views are related, with advocates of rehabilitation in general almost twice as likely as punishment-oriented Americans to favor alternative sentencing programs, 63 vs. 34 percent.)
Views on programs to help people who’ve previously been imprisoned find jobs are complicated by the fact that, on one hand, most Americans believe they are treated unfairly, but on the other, many (49 percent) blame formerly incarcerated people’s own behavior for the inequality they face. Regardless, majorities overall support each of three policies tested: Two-thirds back increased spending on job training and job placement for the formerly imprisoned, 56 percent support laws restricting hiring discrimination against them, and 55 percent favor tax incentives for employers to hire them.
Support for each of these policies is substantially stronger among Americans who believe that discrimination against people who’ve been imprisoned is due chiefly to social conditions rather than their own behavior. Those who mainly blame social conditions are 21 to 27 points more likely to favor each program, compared with those who mainly blame former prisoners’ behavior.
Results of statistical modeling align with these findings. Support for alternative sentencing programs and for policies aimed to increase employment opportunities for formerly incarcerated people is related most closely to seeing discrimination against them as a problem, attributing such inequality to social conditions, and seeing individual and societal prosperity as linked.
Those who think government anti-discrimination programs work well also are likely to support criminal justice reform, controlling for other factors including political ideology and partisanship. Support is lower, meanwhile, among those who prioritize loyalty, authority, and acting honorably; those who value traditionalism; and those who regard group inequalities as acceptable.
Of the individual criminal justice issues tested, agreement is broadest on opposition to stop-and-search policies based on race and ethnicity: Eighty-six percent of Americans say this should not be permitted, including 63 percent who think system-wide training programs are needed to avoid racial or ethnic profiling. (The rest prefer retraining of individual officers.)
In terms of drug laws, 52 percent favor legalization of marijuana for personal use, while views of cocaine are very different—92 percent think its possession should remain illegal. Of those who think cocaine possession should be illegal, 53 percent also say it warrants jail time; far more favor drug treatment programs (73 percent) or a fine (69 percent). Among other options, 56 percent favor community service, while 47 percent favor probation.
Immigration Policy
In another area, Americans divide between blaming inequality faced by undocumented immigrants on social conditions or on their own behavior—36 percent apiece, with the rest blaming some of both. Nonetheless, 56 percent support a path to citizenship for undocumented immigrants now living in the United States—and that soars to 83 percent if they first pay a fine, pay back taxes, learn English, and pass background checks.
There’s considerable overlap between predictors of support for a path to citizenship and of support for other policy items. Most important are thinking that social conditions, more than group members’ behaviors, are responsible for inequality faced by undocumented immigrants and Latinos alike; believing in “linked fate” in prosperity; seeing inequality as unacceptable; having had recent personal interactions with undocumented immigrants and Latinos; and believing that government programs intended to address inequality actually work.
Within-issue Support
While overall support for the policies described above varies, individuals’ views on these topics tend to be closely related. That is, regardless of the social issue, the survey results show a pattern of within-issue coherence: Those who support one policy addressing a specific social problem are far more likely also to favor other policies aimed at addressing that issue.
Supporters of any of the individual poverty-reduction policies, for example, are more likely than others to support other policies and programs to help the poor. For instance, Americans who place a high priority on improving public education as a means of reducing poverty are vastly more likely to prioritize other anti-poverty programs, by broad 31- to 45-point margins, compared with those who view improving public education as less important. In the three biggest differences, those who say improving public education is a high priority are significantly more likely to prioritize holding down interest rates on student loans (by a 45-point margin), increasing the minimum wage (by 39 points), and expanding job training (by 38 points).
Spending preferences on federal anti-poverty programs are likewise consistent. Seventy-five percent of those supporting increased funding for unemployment benefits also favor increasing spending on food stamps. Conversely, 86 percent of those who think unemployment benefits should remain as they are or be reduced say the same of food stamp funding.
This within-issue consistency is not unique to anti-poverty measures. The same pattern appears for views of housing discrimination and backing of criminal justice reforms. Individuals who support one of the policies addressing a particular social issue tend to support many, while those who oppose one tend to oppose many.
Cross-issue Support
While support for policies focused on the same issue are strongly related, the Opportunity Survey also reveals a great deal of cross-issue congruence. A key takeaway of this survey is the finding that views on issues and willingness to take action (detailed next) reflect a general orientation toward equality and fairness. This orientation derives from deep-seated values and experiences (see Sections II and III) and, as described in this section, often results in individuals showing similar support, or opposition, across a variety of social issues.
To examine these relationships, variables were created based on respondents’ support for each issue tested. For example, the number of individual anti-poverty policies and programs each respondent supported was tabulated, with the public then divided into groups reflecting low, moderate, and high levels of support for anti-poverty initiatives overall. A similar strategy was used to group individuals by their support levels for each of the other issue categories.2
2. See Appendix D for details of these indices; the same items are used here, but as counts, rather than the average scores used in the regression analysis.
As the following table illustrates, there is a strong relationship between support for anti-poverty measures and support for each of the other social issues examined, with those Americans who support the highest number of anti-poverty initiatives between 28 and 36 points more likely than those who back the fewest anti-poverty policies to support a pathway to citizenship, view housing discrimination as a problem for many groups, and support reforms to the criminal justice system. This pattern of cross-issue support is robust regardless of the issues compared and reflects a general orientation of support or opposition across the social policies tested.
For example, support for anti-poverty policies and backing for prison reforms are closely linked. People who support most of the anti-poverty measures tested (i.e., at least seven of 11) are 36 points more likely to be highly supportive of reforms to the criminal justice system and job aid for people who have been incarcerated, compared with those who back four or fewer of the anti-poverty policies. Conversely, those who most strongly oppose changes to the criminal justice system and assistance to formerly imprisoned people are 27 points less likely to back the majority of anti-poverty policies, compared with those who strongly back prison reforms.
Looking at individuals on the extreme high and low ends of support for anti-poverty policies is informative. Sixty-four percent of those who support at least 10 of the 11 anti-poverty programs also support at least four of the five policies to reform the criminal justice system and aid the formerly incarcerated, and just 4 percent in this group oppose all of the criminal justice initiatives. But among those who support one or none of the anti-poverty policies, just 10 percent back at least four prison reforms, and 46 percent support just one or none.
While this pattern remains fairly consistent regardless of the specific policy, there are two pairings that show especially strong congruence: Those who back job training programs for formerly incarcerated people are 30 points more likely than others also to back job training programs to reduce poverty generally; and those who support laws restricting hiring discrimination against former prisoners are 26 points more likely than others to highly prioritize increasing the minimum wage.
Views on anti-poverty policies and housing discrimination also are strongly linked. For example, those who see substantial housing discrimination for most groups tested in the survey are 25 points more likely to support most anti-poverty policies, compared with those who think housing discrimination is only a problem for a few groups, if any.
In addition, support for criminal justice reform is closely related to support for a path to citizenship. Those who more strongly support reform are 42 points more likely to favor an unrestricted path to citizenship than those who only weakly support changes to the criminal justice system (74 vs. 32 percent).
Further evidence of a general social justice orientation is evident in the overall alignment of perceptions of the extent of housing discrimination with support for criminal justice reforms. In this case, patterns based on beliefs about the particular groups that face substantial housing discrimination help to explain where these issues are most and least congruent.
The results show that support for alternative approaches in the criminal justice system and job training for formerly incarcerated people peaks among people who see widespread housing discrimination against groups that are disproportionately impacted by the legal system. Perceptions of housing discrimination against groups that are less impacted by the legal system, in contrast, are only weakly tied (if at all) to support for criminal justice reforms.
For example, those who believe that housing discrimination is a widespread problem for people who have been imprisoned, blacks, undocumented immigrants, and Latinos are more likely—by double-digit margins—to support jobs programs for formerly incarcerated individuals, back alternative sentencing, and favor greater rehabilitation efforts.
Specifically, those who see a great deal or a substantial amount of housing discrimination against undocumented immigrants are 20 points more likely than those who see little or no such discrimination to back laws restricting discrimination against people who have served a prison sentence (62 vs. 42 percent). They’re also 20 points more apt to think society would be better served by greater rehabilitation rather than stricter punishment for people convicted of crimes (51 vs. 31 percent). And they’re 19 points more likely to support job training for those who have previously served a prison sentence (71 vs. 52 percent), 15 points more likely to back tax incentives for employees who hire the formerly incarcerated (59 vs. 44 percent), and 15 points more likely to favor more alternative sentencing for people convicted of nonviolent crimes (53 vs. 38 percent).
Backing for reforms to the criminal justice system is more weakly and less consistently impacted by perceptions of housing discrimination against Asian Americans, women, single parents, people with disabilities, Muslims, gay and lesbian couples, and Native Americans. The congruence between perceptions of discrimination and policy preferences thus appears to be at least sometimes predicated on sensitivity toward individual groups.
Taking Action
Perceptions of discrimination and support for social policies intended to address it are precursors of willingness to take action. Motivation to get involved peaks among people who believe that inequality for certain groups exists, see it as systemic, support policies that aim to combat poverty, favor change in the criminal justice system, and support greater access to citizenship.
Overall, more than half of Americans indicate a willingness to take action to improve opportunities for poor people (59 percent) and women (58 percent); an additional 7 and 5 percent, respectively, say they’re already involved in such efforts. Fewer, about 40 to 50 percent, express willingness to work toward improving opportunities for Native Americans, blacks, and Latinos (as well as whites); that drops to about a third for gays and lesbians, Asian Americans, undocumented immigrants, and people who have served prison sentences. (These numbers include the few who say they’re already doing such work.)
In terms of issues rather than groups, two-thirds or more say they’re likely to get involved (or already are involved) in efforts to reduce poverty in the United States (70 percent) and to encourage equal opportunity for all groups (67 percent). That drops to fewer than half when it comes to seeking fair treatment for minorities in the criminal justice system (48 percent), securing the border with Mexico (46 percent), and providing a path to citizenship for undocumented immigrants (40 percent).
Willingness to take action, while meaningful in a general sense, of course depends on the type of action. As might be expected, the Opportunity Survey finds broader openness to less-committing participation, such as talking with others or signing a petition, compared with contacting an elected official, volunteering, or protesting.
At the top of the list, 67 percent say they are likely to talk with people they know about their views (including 8 percent who say they already do) and 62 percent say they’d sign a petition (or have done so).
Those compare with 52 percent for boycotting products or vendors and 46 to 50 percent for contacting an elected official, volunteering with a community or political organization, or donating money.3
3. These items were asked of those who said, in general, that they were very or somewhat likely to take action, or already were taking action, on behalf of a group or issue. Those who did not indicate a willingness to take action in general (252 of the 2,055 respondents) are grouped in this analysis with those who indicated an unwillingness to take a particular action. Therefore, the percentages reported here reflect how many people in the population overall are willing to take each action.
Many fewer, just more than a third, say they’d be likely to write or post something online or in print to persuade or motivate others on behalf of a cause (36 percent) or to participate in a creative or artistic project that brings attention to the issue (34 percent). And 27 percent say it’s likely they’d take part in a protest, march, or demonstration.
Notably, for each of the actions tested, far fewer indicate they’re “very” likely to participate, and, as noted, only a handful say they’ve actually done so—highlighting the gap between willingness to act and actually taking action.
Bridging that gap might be helped by understanding the top predictors of expressed willingness to get involved. Most important is frequency of personal contact with members of different groups, suggesting that personal interactions with people from different backgrounds are particularly critical in motivating action on equality issues.
Other shared predictors are perceived seriousness of discrimination against groups, feelings of personal and group efficacy (i.e., the belief that meaningful change can be achieved), the perception that people are linked in their quest for prosperity, and the personal importance of group identity.
Cross-action analysis: Groups
Analysis of Americans’ willingness to take action on behalf of different groups4 reveals patterns that reflect an individual’s general orientation toward social justice and equal opportunity, as well as their perceptions of those groups.
4. The groups include poor people, Latinos, women, undocumented immigrants, gays and lesbians, black men, black women, Asian Americans, Native Americans, people who have served a prison sentence, and, for comparison, whites.
Overall, there’s evidence of a general motivation to improve opportunities for individuals, regardless of social group or status: Those expressing willingness to act on behalf of one group are more likely to say they’ll do the same for all other groups. This may partially reflect an underlying belief in “linked fate” between the prosperity of all groups and individual prosperity, as well as a general willingness to act. Indeed, those who say they’re likely to take action to support opportunities for disadvantaged groups also are 27 to 53 points more likely than others to say they’re likely to take action to improve opportunities for whites.
Still, patterns in willingness to take action suggest that some groups are more closely linked than others. One notable example is an overall willingness to improve opportunities across racial and ethnic minority groups, including Latinos, black men, black women, Asian Americans, and Native Americans.
For example, among those more likely to act on behalf of Latinos (or who already do), 80 percent also say they would support efforts to benefit black men—compared with only 13 percent of those who are less willing to support Latinos. Similarly, those more apt to act in support of black women are 63 points more likely than others to do so for Native Americans. And those who are more willing to support Asian Americans are 68 points more likely than others to say they’d work to support Latinos.
Other patterns appear to reflect relationships between social conditions and the groups most likely to experience them. Interest in taking action in support of those who have served a prison sentence is related to higher levels of interest in action to benefit black men and black women, groups disproportionately affected by the justice system. Those who say they are more likely to take action to improve opportunities for the formerly incarcerated are 55 points more likely to support improved chances for black men and black women alike.
There’s a similar dynamic between supporting improved opportunities for the poor and for other groups. Those who say they are more likely to act to improve opportunities for the poor (or who already do) are at least 50 points more likely to say they would actively support efforts on behalf of women, Native Americans, black women, black men, and Latinos, compared with those who are less willing to help poor people.
There also are patterns of congruence where expected, e.g., between Latinos and undocumented immigrants, between all women and black women, and between black men and black women.
In sum, the data suggest that while there is an overall orientation toward or against taking action to improve opportunities for groups, behavioral intentions are most similar among groups that are viewed as linked in some way.
Cross-action analysis: Issues
As with groups, those who indicate a willingness to take action in support of one issue are generally more likely to act on other issues as well. This holds across the five issues tested—ensuring fair treatment for minorities in the justice system, providing a path to citizenship, securing the border with Mexico, reducing poverty, and encouraging equal opportunity for everyone—although one, securing the border, shows somewhat less alignment with the others.
For example, those who say they are likely to take action (or already are doing so) to support a path to citizenship also are 36 to 49 points more willing than others to take action in support of fair treatment of minorities in the justice system (77 vs 28 percent), encouraging equal opportunity (92 vs. 51 percent), and reducing poverty (92 vs. 56 percent).
Similarly, with the exception of securing the U.S. border, willingness to take action on the other issues is 44 to 50 points greater among those who are willing to take action to ensure fair treatment for minorities in the criminal justice system and 42 to 61 points greater among those who are likely to support efforts to reduce poverty or to promote equal opportunity.
While willingness to take action to secure the U.S. border with Mexico does not show the same strong relationship with the other issues, the underlying propensity toward social action still is apparent.
Those who are apt to take action on this issue are 14 to 26 points more likely than others to indicate a willingness to take action on the other issues measured—smaller, but still statistically significant differences.
Some individuals, then, simply are more likely than others to be willing to take action to support social causes. (The underlying reasons are detailed in the modeling results in Section III.) Indeed, on some issues the overlap is nearly perfect: Among those who are willing to support efforts seeking fair treatment of minorities in the criminal justice system and those willing to take action to provide a pathway to citizenship, more than nine in 10 also say they’d take action to reduce poverty and encourage equal opportunity, alike.
Cross-action analysis: Behaviors
In addition to examining a general propensity toward action on behalf of social issues or groups, the Opportunity Survey assessed the relationship among specific actions that individuals can take to aid groups or issues they support.
In line with other results, Americans’ likelihood of saying they’ll engage in any one behavior on behalf of a cause strongly relates to their likelihood of engaging in other actions—another reflection of a general propensity to act that, as described in Section III, reflects individuals’ deeply held values, attitudes, and experiences.
As noted, Americans are most willing to talk with others about a social cause, with two-thirds saying they’re likely to do this (or already do). While this is one of the easier actions to take, those who are willing to discuss their views also are far more likely than others to say they’d engage in other behaviors (by a 45-point margin, on average), including those requiring greater commitment.
Specifically, compared with those who are unlikely to talk about their views on social issues, those who are likely to do so are 56 points more likely to be willing to sign a petition; 51 points more likely to say they’d volunteer or contact an elected official; 48 points more likely to be willing to boycott a product or vendor; 44 points more likely to be willing to write something to persuade or motivate others; 43 points more likely to donate money; 38 points more likely to participate in a creative project that brings attention to an issue; and 31 points more likely to take part in a protest, march, or demonstration.
The finding that simply being willing to talk with others about one’s views is so strongly tied to willingness to take other, more committed action suggests that convincing individuals to take even small steps ultimately can have a major impact. As decades of psychological research has shown, getting an individual to commit to one small action makes it far easier to convince them to commit to bigger ones.
Although all of the action types are strongly related, the data suggest two distinct groupings that reflect the level of effort and public dedication required. Lower effort and more private actions include talking with others, signing a petition, boycotting, donating money, volunteering, and contacting an elected official. Three other behaviors fall into a higher effort/more public category: participating in creative or artistic projects to bring attention to an issue; writing something to persuade others; and taking part in a protest, march, or demonstration. These seem linked by greater effort, greater comfort with public attention, or both. Moreover, it may be easiest to convince those who are already taking some action to engage in other behaviors that require similar levels of effort and public comment.
02. Orientations and Experiences
Previous research on attitude formation, perceptions of equality, and intergroup dynamics has shown that understanding people’s attitudes and readiness to take action on issues requires a detailed exploration of their basic social orientations—the ways they perceive society as working, including the roles of groups and individuals within it. These are informed most fundamentally by their values and experiences, as well as their demographic characteristics.
Specifically, the literature suggests that views on social issues are rooted in basic orientations that make up individuals’ core ideologies and predict their political and policy preferences. These include moral values, preference for tradition vs. change, views on equality vs. hierarchy, and perceived fairness of societal systems.
Statistical analyses of the Opportunity Survey data show that other factors also come into play. One is group membership, particularly the extent to which people see their race, ethnicity, economic status, gender, or sexual orientation as central to their sense of self. Another is attributions for group-based inequality—whether people see group members themselves as responsible for a lack of opportunity, or blame broader social conditions. Additionally, the belief that one or one’s group can have an impact—efficacy—is a key component of willingness to take action.
Measuring and evaluating these basic orientations, then, is central to a deeper understanding of the roots—and possible directions—of public attitudes on social conditions and change.
Basic Values
Using past research as a guide, this survey examined five moral foundations that are thought to form early in life, well before political views—compassion, equality, loyalty, respect for authority, and behaving honorably. Respondents ranked each in order of personal importance.
“Acting in an honorable way” is ranked as most important by the largest group, 35 percent of adults, and well more than half—57 percent—place this value first or second. “Treating everyone equally” is the top value for just more than a quarter of Americans, and in the top two for half. Compassion and “being loyal to your country” are principal for about one in six apiece (17 and 14 percent, respectively). The fifth value, respect for authority, comes in last as a primary guiding principle, ranked first by just 6 percent, and first or second by one in five.
There’s a strong relationship between these values and political ideology. Americans who rank compassion or equality as most important are 18 points more likely to identify themselves as liberal than conservative (42 vs. 24 percent). This flips among those who rank loyalty to country, respect for authority, or acting honorably as most important—in this group 40 percent are conservatives, 24 percent liberals.
Attitudes on issues follow. As detailed below, statistical modeling of the Opportunity Survey data shows that, controlling for other demographic and attitudinal factors, those who prioritize loyalty, respect for authority, and behaving honorably are less likely than others to perceive unequal treatment of groups as a serious problem, to think there is substantial discrimination in housing, and to support measures meant to reduce poverty or to increase alternative sentencing and rehabilitation efforts in the criminal justice system.
In addition to these five basic foundations, views on tradition vs. innovation also underpin attitudes on social issues. By a more than 40-point margin, 71 to 29 percent, Americans are more apt to select trying “new ways of doing things” as more important to them than maintaining traditional approaches. They’re also much more likely to feel that way strongly.
This openness to innovation, however, is tempered when it comes specifically to moral standards. On this, Americans are more evenly divided, with 52 percent saying that developing their own moral standards is more important than following traditional morality. Regardless, in both cases, tradition vs. innovation again strongly relates to political ideology, with innovation much more likely to be prioritized by political liberals, tradition by conservatives. Preference for tradition in general predicts less concern about discrimination and less support for policies to address poverty.
Equality vs. Hierarchy
In a broad endorsement of opportunity principles, an overwhelming 85 percent of Americans feel that society functions better when all groups have an equal chance in life, including 57 percent who feel that way strongly. Only 15 percent say it’s better to have “some groups on top and others on the bottom.”
Likewise, just one in 10 calls it entirely acceptable for one group to have more opportunities in society than others, although an additional 27 percent see this as “somewhat acceptable.” Slightly more than six in 10 call this unacceptable, including 23 percent who say it’s entirely unacceptable.
Seeing group inequalities as unacceptable is among the top predictors of perceiving discrimination against groups as serious, seeing more discrimination in housing, supporting measures to address poverty and a path to citizenship, and being willing to act on a range of social policy issues.
Other views, though, indicate a possible rationalization of group inequality. A majority of Americans—57 percent—say it’s at least probable that some groups of people are smarter than other groups. This may indicate a distinction between views on equality of opportunity, based on a fair chance, compared with inequality of outcomes, given not just effort but ability, or intelligence, as well.
Fairness of Society
Attitudes on social policies also are informed by perceptions of a “just world” and fairness in society. The literature shows that, to varying degrees, people prefer to believe that those who work hard rise to the top and that people get what they deserve. Such views are more comforting than believing that a person’s lot in life is due largely to circumstances outside his or her control. That provides motivation to justify and rationalize societal systems as fair, especially among disadvantaged groups, a sentiment that manifests itself as support for the status quo.
Measuring one such sentiment, the Opportunity Survey finds roughly an even split between the belief that equal opportunity is afforded to all or most groups (37 percent) versus just some or only a few groups (39 percent). The remaining 24 percent fall in the middle.
Another such measure, perceptions of how often the best person in an organization rises to the top, produces a less differentiated result. Most, 59 percent, fall in the middle, saying that sometimes the best person wins out, and sometimes he or she does not. Among the rest, about a quarter say that the most deserving candidate tends to succeed, while 18 percent say this either rarely or almost never happens.
Identity, Attributions, and Experiences
Personal experiences and perceptions play a role in social policy attitudes and behavior as well. Among these are the extent to which group membership is important to an individual’s sense of self, personal experiences with unfair treatment, attributions for the causes of inequality faced by groups, and familiarity with other groups via personal contact.
Also important is the extent to which people think they personally can bring about change on issues that matter to them and that disadvantaged groups as a whole, likewise, have the ability to foster change.
Group identification
Statistical modeling shows that the more respondents identify with the groups to which they belong (that is, view their group memberships as personally meaningful), the more likely they are to see unfair treatment of groups as a serious problem and to express willingness to take action on behalf of groups and on issues that matter to them.
Many group identities overlap, and many vary in their prevalence across groups. Overall, Americans cite their gender, being a parent (where applicable), and their religious affiliation as most important to their sense of self, with half or more calling these very important or essential to who they are. National origin, race, sexual orientation, and ethnicity are important to more than four in 10 Americans apiece. Economic class and political beliefs are somewhat less self-defining overall, with 38 and 37 percent, respectively, calling them central.
As noted, these differ sharply by demographic group. Gender identification, for example, is far stronger among women than men: Sixty-four percent of women call their gender critical to their sense of self, including 36 percent who view it as essential. For men, that falls to 49 and 29 percent, respectively.
Further, more than three-quarters of blacks, 64 percent of Asian Americans, 53 percent of Latinos, and 48 percent of other nonwhites say their race is an important self-defining attribute, compared with 38 percent of whites. Ratings of the importance of ethnicity show a similar pattern.
Racial and ethnic identity peak in intensity among blacks. More than half call their race “essential” to who they are, compared with fewer than three in 10 other minorities and 19 percent of whites. Blacks also are 15 points more apt than any other minority group to view their ethnicity as critical to their self-definition.
Other minority groups similarly stand out for their high levels of group identity. These include noncitizens and naturalized citizens, non-heterosexuals, and very low-income adults, i.e., those with household incomes below 50 percent of the federal poverty level (a group explored in Section IV).
Experience of unfair treatment
Beyond core values and moral foundations, personal experience of unfair treatment because of one’s group memberships can have a profound impact on a person’s attitudes about discrimination overall.
Such experiences are considerable: Sixty percent of Americans report sometimes or often experiencing unfair treatment because of their membership in one or more groups. Most prevalent, four in 10 say they’ve been treated unfairly because of their economic class. Three in 10 report the same based on their gender (32 percent) or their race or ethnicity (31 percent).
Considerably fewer overall—19, 15, and 11 percent, respectively—report being at least sometimes treated unfairly because of their religious beliefs, language fluency, or sexual orientation, but these increase, naturally, in some groups, e.g. among foreign-born adults in terms of fluency and gays and lesbians in terms of sexual orientation.
Indeed, reports of unfair treatment vary greatly across groups. For example:
- Three-quarters of Americans who identify themselves as poor say they’ve been treated unfairly because of their financial situation, as do nearly six in 10 of those who call themselves lower income but not poor, and, in another gauge, 56 percent of people with incomes below 50 percent of the federal poverty level. Those figures compare with just 18 percent among those who say they have upper-middle or higher incomes.
- Seventy-three percent of blacks report unfair treatment because of their race, including 36 percent who say this occurs often. Fifty-seven percent of Asian Americans and 51 percent of Latinos also report experiencing racial bias. It’s just 17 percent among whites.
- Relatively few Protestants, Catholics, or those who profess no religion report unfair treatment because of their religious orientation—15, 13, and 19 percent, respectively. That increases to three in 10 among other Christians (a group that includes Mormons, Pentecostals, Eastern Orthodox, and other Christian groups) as well as 36 percent of non-Christians, such as Jews, Muslims, Hindus, and Buddhists, among others.
- Reports of unfair treatment due to a person’s accent or English-language fluency peak among respondents who took the survey in Spanish (six in 10 report such bias) and bilingual Latinos (41 percent), as well as just more than half of noncitizens and 36 percent of naturalized citizens. Those compare with only 11 percent of non-Latinos or English-dominant Latinos and 10 percent of native-born U.S. citizens.
- Women are significantly more likely than men to say they’ve been treated unfairly because of their gender, 44 vs. 19 percent. Unfair treatment due to sexual orientation, for its part, is far more common among those who identify themselves as gay, lesbian, or bisexual than it is among heterosexuals, 43 vs. 9 percent.
Conversely, while 40 percent of respondents overall say they’ve rarely or never experienced unfair treatment on the basis of the factors tested in this survey, that number falls sharply among certain groups. Only 16 percent of black men say they’ve rarely or never personally experienced such treatment, as do just two in 10 self-identified poor Americans and non-heterosexuals and about a quarter of black women, Asian Americans, Latinos, and noncitizens alike.
Personal experience with unfair treatment is a strong predictor of several key variables. Those reporting it are more likely than others to perceive unjust treatment of groups in general as a serious problem, to see discrimination in housing, and to say they’d take a variety of specific actions on behalf of issues and groups that are important to them.
Social comparison
Americans divide on whether the group they identify with most closely has things better than most others (41 percent) or is doing about the same (44 percent); many fewer, 15 percent, view their group as worse off. Again, though, there are sharp demographic differences.
Just 22 percent of blacks and 27 percent of Latinos feel that the group they identify with most has things better than other groups, while 49 percent of whites say so. By contrast, 38 percent of blacks and 21 percent of Latinos think they’re worse off than others, compared with just 9 percent of whites. More generally, all those who strongly identify with their race or ethnicity are more apt than others to say their group has it worse off, 30 percent vs. 13 percent.
Perceiving one’s own group as being deprived in comparison with others can heighten perceptions of injustice and motivate collective action. This effect can be limited, however, by the deep-seated orientations discussed earlier, as well as by perceptions of efficacy. Indeed, the belief that one’s own group has things worse than others is a limited predictor of willingness to take action on behalf of others when these other variables also are included as predictors.
Attributions for inequality
Another factor in motivation to address inequality is the extent to which people feel that different social groups in effect are responsible for their outcomes. Most Americans, 70 percent or more, reject this notion as it pertains to a variety of groups, saying instead that group-based inequality is at least partially due to social conditions, rather than solely reflecting a group’s own behavior.
However, there is wide variability in this view depending on the group in question. At one end of the spectrum, most adults blame the unfair treatment of women and Native Americans entirely or mainly on social conditions; just 13 percent, in both cases, blame those groups’ own behavior. That shifts dramatically when it comes to people who have served a prison sentence—49 percent blame their behavior—or those who are undocumented immigrants, blamed by 36 percent.
These views make a difference. As noted, those who tend to attribute inequality more to formerly incarcerated people’s own behavior are significantly less apt than others to support policies focused on rehabilitation and re-employment. Similarly, support for a path to citizenship for undocumented immigrants declines among those who see this group as largely to blame for the inequality its members experience. In another example, while comparatively few people view the poor as responsible for their own plight, those who do are less likely to support anti-poverty programs.
Personal responsibility
Attributions for group inequality, called “deservingness” in the literature, correspond with views of personal responsibility. Overall, two-thirds of Americans believe that individuals are responsible for their own prosperity, with 42 percent feeling that way strongly. Far fewer, 32 percent, perceive linked fate—the notion that the prosperity of one is linked to the prosperity of all. Those who are more inclined to believe that individuals are responsible for their own outcomes also are more apt to emphasize group behavior as the main cause of inequality.
Just like group-based vs. societal explanations for inequality, views on linked fate predict policy preferences and the intention to take action on inequality, as well as attitudes about discrimination more generally. As detailed in Section III, those who are more inclined to see prosperity as linked are more likely to view unequal treatment of groups as a serious problem, support policies to address each of the issues tested, and express greater willingness to take action on opportunity issues.
Perceptions of group and individual responsibility correspond to basic values and moral perceptions. Belief in linked fate and in societal causes for inequality peaks among those who more highly value compassion and equality, who choose innovation over tradition, and who see inequality of opportunity. Those who stress individual responsibility and behavioral reasons for unequal treatment are more apt to prize loyalty, respect, and honor; to prefer tradition; and to think society offers equal opportunity to all.
Core values and beliefs are highly challenging to change. Individuals appear most open to discussion of social issues and the causes of inequality within a framework that corresponds with their basic values and attitudes about how society functions.
Familiarity with other groups
Policy views and behavioral intentions also can be influenced by people’s familiarity with those who belong to a different group than their own. That familiarity was assessed by asking people whether or not they had eaten a meal (outside of work) in the past year with a friend who is white, black, Latino, Asian American, poor, gay or lesbian, or an undocumented immigrant, and if so, how often.
Among the results, 74 percent of nonwhites dined with a white person in the past 12 months; a third say they did so frequently. Sixty-eight percent of whites say they’ve dined with a black person, Latino, or Asian American in the past year, just 19 percent frequently. Fifty-seven percent of non-blacks say they’ve dined with a black person; 12 percent say they did this often.
Additionally, 57 percent of those who do not identify themselves as poor dined with a poor person, 49 percent of non-Latinos with a Latino, 47 percent of heterosexuals with a gay or lesbian, and 40 percent of non-Asian Americans with an Asian American. Just 16 percent of citizens say that (as far as they know) they’ve shared a meal with an undocumented immigrant.
Such contact is important in motivating policy support and action. As covered in Section III, frequency of contact with the poor is a significant predictor of support for policies aimed at alleviating poverty, and respondents who indicate greater familiarity with undocumented immigrants and with Latinos—regardless of their own citizenship status or ethnicity—are more apt to support a path to citizenship.
More broadly, an index created by averaging contact with members of different groups is the single strongest predictor of three key behavioral outcomes: intention to take action on behalf of different groups, to advocate for social policy issues, and to engage in a variety of specific activities on behalf of these groups or issues.
Personal and group efficacy
Beyond core values and perceptions about causes of inequality, efficacy also is critical: Simply put, individuals are unlikely to take action if they lack confidence that doing so will help.
Overall, Americans’ personal efficacy—the belief that they can bring about the change they desire—is fairly low. Barely a quarter feel they have the ability to help change things for the better on issues of importance to them, including just 6 percent who feel they can have a “great deal” of impact. Four in 10 instead feel they have very little or no ability to have an impact on issues of personal importance, with the rest in the middle.
Beliefs about group rather than personal efficacy are stronger, at least for some groups tested. Six in 10 Americans feel that women have a great deal or good amount of ability to change things for the better; more than half say so about blacks, and nearly half about gays and lesbians. Far fewer—just 29 and 25 percent—say the same of poor people and undocumented immigrants, likely reflecting their lower perceived status in U.S. society.
The gaps between personal and perceived group efficacy may reflect an underlying belief that collective action—people coming together to change things that are important to them—is more effective than individuals acting alone. Regardless, since efficacy, as indicated, is a precursor to action, it’s a quality those seeking change would do well to emphasize.
03. Modeling, Cluster Analysis, and Group Characteristics
The literature (reviewed in detail in Appendix A) suggests that while political ideology is a very strong predictor of social policy attitudes, ideology itself is determined by people’s pre-political orientations to the social world. Among these are acceptance or opposition to equality, openness or resistance to change, and general perceptions of society’s fairness. Even more basic values and moral principles tend to underlie these orientations.
Personal experience and fundamental beliefs about society and different groups’ standings in it also influence social policy attitudes and, particularly, willingness to take action. Factors include beliefs about the extent to which group inequalities are caused by social conditions vs. the behavior of group members, personal experiences with unfair treatment, the extent of personal contact with members of different groups, and perceptions that disadvantaged groups can successfully bring about change.
Using these basic orientations, experiences, and beliefs, two types of statistical analyses were conducted using the Opportunity Survey data. Regression analyses identified the factors that most motivate people overall to support and take action on social issues, and cluster analyses identified six distinct population groups that succinctly summarize the varying constellations of attitudes and behaviors relating to social policy on equality issues (see Appendix D for greater details about the statistical analyses).
Modeling Takeaways
The regression models examined the central predictors of eight key outcomes. These include five overall attitudes—perceptions of unequal treatment of different groups as a serious problem, views on the severity of housing discrimination faced by various groups, backing for anti-poverty measures, support for criminal justice reforms, and views on a path to citizenship for undocumented immigrants. Also included were three measures of willingness to take action—on behalf of social issues, on behalf of specific groups, and in terms of a variety of specific civic behaviors on behalf of a cause.
Of most interest are those variables that are predictors in all or nearly all of the eight outcomes, as these are the crucial attitudes, values, and experiences that, all else equal, best predict an orientation toward opportunity issues. For example, belief in “linked fate” (i.e., that one’s prosperity is linked to the prosperity of all) is a significant predictor in all eight models. Those who are more inclined to see an individual’s success as directly tied to prosperity of all people are more supportive of all five attitudes examined and are more willing to take social action compared with those who believe individuals are chiefly responsible for their own prosperity.
The extent to which individuals identify with the groups to which they belong (be it their race, ethnicity, nationality, gender, sexual orientation, economic class, religion, or political group) also is an important factor in most of the models. Those who more closely identify with their groups are more likely to perceive unequal treatment as a serious problem, to view housing discrimination as prevalent, to back anti-poverty measures, to express willingness to take action on behalf of groups and social issues and to be willing to take specific civic actions.
These models also show that, all else equal, Americans who more strongly see group-based inequality as unacceptable are significantly more likely than others to express sensitivity toward social issues and to say they’re willing to take action to support such issues, including specific behaviors intended to bring about change.
Likewise, those who feel it is more important to develop one’s own moral standards (as opposed to following traditional morality) and those who prioritize values of equality and compassion over loyalty, authority, and honor are more likely to perceive unequal treatment of groups as a problem, more apt to see housing discrimination as prevalent, and more likely to support anti-poverty initiatives. Those who prioritize equality and compassion also are more likely to support reforms of the criminal justice system and to support a pathway to citizenship for undocumented immigrants. Similarly, those who express a preference for trying new ways of doing things (as opposed to sticking with tradition) are more likely to support all eight outcomes.
There are other important factors in several of the models. These include perceptions of how serious a problem people see unequal treatment of groups to be and perceived reasons for the inequality those groups face. Seeing unequal treatment of the poor as a serious problem, for instance, is the single strongest predictor of support for anti-poverty programs. And attributing the inequality poor people face to society overall, rather than to individual group members’ behavior, also is a significant positive predictor.
Similarly, support for reform of the criminal justice system is most strongly predicted by the belief that unequal treatment of formerly incarcerated individuals is a serious problem, followed closely by attributing the inequality faced by those who have been to prison to societal, rather than behavioral, factors.
Attributions for inequality also are important in the model predicting support for a pathway to citizenship for undocumented immigrants. All else equal, those who believe that the inequality undocumented immigrants face is due to social conditions are more likely to support an unrestricted path to citizenship. The same is true for attributions for inequality faced by Latinos—those who see a societal rather than an individual basis for Latino inequality are more apt to support a path to citizenship.
Viewing unequal treatment of groups as a serious problem in general and attributing that inequality to societal conditions also are significant predictors of intentions to take action to improve opportunities for different groups and willingness to act to support various social issues. Perceiving inequality as a serious problem also predicts willingness to engage in specific behaviors to support a cause, albeit less strongly.
Social policy views are linked to personal experience with unfair treatment; it’s one of the top predictors of perceptions of the seriousness of unequal treatment in general and the extent of housing discrimination in particular. Those who say they frequently have been treated unfairly because of their group membership are more likely to view both unequal treatment and housing discrimination as serious problems.
Experience with unfair treatment also appears to motivate action. Those who most frequently have been treated unfairly because of their group memberships are significantly more likely than others to express willingness to engage in specific civic behaviors in order to further a social issue or help particular groups.
Among other factors, having frequent recent personal contact with people from a diverse set of groups is a positive predictor of support for anti-poverty measures. Frequency of personal contact with undocumented immigrants or Latinos, in particular, predicts support for a pathway to citizenship. The model holds all other variables, including race and ethnicity, constant—meaning that regardless of one’s own group membership, greater contact with Latinos and with undocumented immigrants appears important in support for a path to citizenship.
Frequency of personal contact with diverse groups also is the strongest predictor of willingness to take action on behalf of groups or issues and to engage in a variety of specific civic behaviors. This suggests that comfort with diversity, while not essential to support for the social issues tested, may be crucial in motivation to act.
Similarly, the belief that individuals and disadvantaged groups, respectively, can help change things for the better on issues that are important to them are consistent predictors of willingness to take action. Efficacy as such appears to be critical in determining whether or not people are willing to take action on social problems.
Key demographic predictors across models
A number of individual characteristics are highly predictive in the regression models, even when beliefs, values, and experiences are held constant. Age is a positive predictor in six of the eight models, with older Americans more likely to see unequal treatment as a serious problem, to view housing discrimination as widespread, to favor greater efforts to address poverty and to improve the criminal justice system, to be willing to act to improve opportunities for groups, and to say they would take specific actions on behalf of a social cause.
Race and ethnicity also play a role, with blacks and Latinos more likely to see unfair treatment of groups as problematic and more willing to take action on behalf of groups and issues. Latinos also are more likely to prioritize addressing poverty and to support a path to citizenship.
Asian Americans, in contrast, are generally less apt to support the social issues and actions studied in the Opportunity Survey. They are significantly less likely to perceive housing discrimination as a widespread problem, to prioritize anti-poverty measures, or to say they are likely to engage in a variety of actions on behalf of issues or groups. Asian Americans also are somewhat less apt to support alternative sentencing or programs to benefit formerly incarcerated people.
Education has a mixed effect. Greater education predicts seeing unequal treatment as a serious problem, support for alternative sentencing programs, and backing for a path to citizenship; however, it’s negatively related (albeit fairly weakly) to taking action to improve opportunities for different groups and to support different issues.
Religiosity also is important; holding all else equal, those who more frequently attend religious services are more apt to see housing discrimination as prevalent, support alternative sentencing programs and employment for the formerly incarcerated, favor a path to citizenship, and be willing to take action on issues and to support various groups.
Not surprisingly, partisan and ideological affiliations also are related to these outcomes. Political ideology is one of the two most important predictors in three of the models, with those who identify as more conservative than liberal being significantly less likely to perceive unequal treatment of groups as a serious problem, to see housing discrimination as common, or to support anti-poverty programs. More conservative Americans also are less likely to support reforming the criminal justice system, holding other factors constant.
In terms of partisan affiliation, self-identified Democrats are more likely to perceive unequal treatment of groups and housing discrimination as serious problems and to put a priority on anti-poverty measures. Democrats also are significantly more likely than Republicans and independents to support a path to citizenship and to be willing to take action in support of different issues and groups. Republicans are less apt to say they would take specific actions on behalf of a social cause or to favor criminal justice reforms.
Cluster Analysis
While regression analysis identifies variables that independently predict support for issues in the overall population, cluster analysis identifies unique subsets of the population that are more or less apt to back social issues and be willing to take action.
Specifically, using key attitudes and behaviors relating to social policy on equality issues, the cluster analysis performed for the Opportunity Survey identifies six distinct population segments. These groups differ substantially in their values and concepts of equality, fairness, and tradition—and, in turn, in their policy preferences and openness to action, in line with the main findings of the social psychology literature.
Cluster analysis is a statistical method that groups individuals based on specific sets of characteristics. The approach, useful in communication and motivation strategies alike, identifies people who are very similar to each other but very dissimilar from those in other clusters in terms of the characteristics of interest.
The selection of variables for the clustering analysis is key to identifying groups that are conceptually meaningful given the topic of interest. Based on previous literature and analysis of the Opportunity Survey, eight variables were selected, each measuring attitudes or behaviors that, in analysis, differentiate groups. These variables (detailed in Appendix D) include average scores assessing:
- Perceived seriousness of unequal treatment of groups
- Likelihood to participate in action to improve opportunities for various groups
- Likelihood to take different specific types of actions on behalf of any group or issue
- The extent to which respondents attribute inequality to societal conditions vs. the behavior of group members
- The extent to which respondents feel that different groups have the ability to change things on issues they care about, known as group efficacy
- The frequency of respondents’ personal interactions with members of different groups
- The extent to which respondents feel they personally have been treated unfairly because of their group memberships
- The extent to which respondents feel various personal characteristics (e.g., their race, gender, or sexual orientation) are important elements of their identity
In addition to their attitudes, experiences, and behaviors, the clusters drawn from these variables reflect core differences in values, beliefs about equality, and perceptions of efficacy, which—in line with the regression analyses—in turn inform political and policy preferences. The groups, labeled on the basis of their characteristics, are described first in overview, then in detail.
Among these groups, core catalysts are most disposed to favor opportunity issues, followed by potential advocates. Ambivalents are conflicted in their attitudes, the disengaged are simply less interested, skeptics lean against these issues, and resistants are more firmly opposed.
Cross-cluster overview
There are substantial differences among these clusters on many basic beliefs and orientations, including preference for tradition vs. change, the acceptability of inequality, the extent to which society is seen as meritocratic, individual vs. societal explanations for success, perceptions of inherent differences in aptitude among groups, and preference for punishment vs. rehabilitation in criminal justice. Examining these differences is essential to understanding each of the six cluster groups.
In terms of basic values, most clusters—potential advocates, ambivalents, the disengaged, and skeptics alike—rank acting honorably as most important, followed by equal treatment. Core catalysts are the only group in which equal treatment ranks first, followed by compassion and acting honorably. Resistants focus less on equal treatment or compassion and more on loyalty and acting honorably.
Majorities in all clusters prefer new ways of doing things, but this view peaks among core catalysts and potential advocates (at roughly eight in 10), followed by skeptics and ambivalents (about seven in 10), then the resistants and disengaged (about five and six in 10, respectively). Further, core catalysts and potential advocates are the only clusters in which most think each person should develop his or her own moral compass, while resistants alone have a clear majority for following moral traditions. The other three clusters divide about evenly.
Core catalysts also are most apt to see inequality in society, with equal opportunity afforded only to some groups. They’re followed by potential advocates, ambivalents, and the disengaged. Skeptics and resistants see the least inequality.
Belief about the acceptability of such inequality also sharply differentiates clusters. Nearly three-quarters of core catalysts and potential advocates say inequality is unacceptable, followed by two-thirds of ambivalents. That falls to slight majorities of the disengaged and skeptics and an even split among resistants.
Group-based identity also is important in differentiating the clusters. Core catalysts are far more likely than potential advocates to see their race, ethnicity, class, gender, and national origin (among other items) as important to their identity—a likely reason potential advocates are less apt than core catalysts to express willingness to take action.
Similarly, experience with unequal treatment is one of the main differences between core catalysts, who are more likely than any other group to report unfair treatment, and potential advocates, who have experienced comparatively little discrimination.
Moreover, core catalysts and potential advocates are most apt to attribute inequalities to social circumstances. Ambivalents and the disengaged tend to split between social and behavioral explanations for group inequality, while skeptics, and especially resistants, tend to say some groups face inequality because of the behavior of group members.
These differences in core beliefs, personal experiences, and feelings of efficacy lead, in turn, to broad differences on the main outcome variables of interest—the perceived seriousness of unequal treatment of groups, policy support, and willingness to take action on issues or on behalf of various groups. The perceived seriousness of unequal treatment is an example: It’s highest among core catalysts, followed, in order, by potential advocates, ambivalents, the disengaged, skeptics, and resistants.
Support for increasing funding for government anti-poverty programs runs highest among core catalysts, followed by potential advocates; resistants are most likely to prefer decreasing funding. The disengaged and skeptics tend to prefer maintaining current funding. Core catalysts also highly prioritize all the anti-poverty policies tested, while resistants and the disengaged generally do not, with potential advocates, ambivalents, and skeptics in the middle. There’s more agreement on public education, Social Security, and student loans and more division on the minimum wage, job training, and infrastructure spending.
Reflecting differences in views of individual responsibility and the extent of inequality, cluster members differ in their attitudes toward criminal justice. Most policies to assist formerly imprisoned people do best with core catalysts and potential advocates. Only among resistants and the disengaged are half or more opposed. At the same time, in only two of the six clusters, core catalysts and potential advocates, do majorities favor rehabilitation over punishment.
Similarly, support for a path to citizenship for undocumented immigrants peaks at 77 percent of core catalysts, followed closely by nearly seven in 10 potential advocates and by 56 percent of skeptics. Slight majorities of ambivalents and the disengaged oppose a path to citizenship, rising to seven in 10 resistants.
Finally, when it comes to action, core catalysts are far and away most likely to say they’d take action on behalf of issues or groups. The disengaged, true to their name, are unlikely to get involved across the board. Potential advocates and skeptics are more apt to act on behalf of the issues tested in this survey than on behalf of groups, with falloff from there among ambivalents and resistants.
Detailed summaries of each group follow.
Core catalysts
Core catalysts, 19 percent of the population, are the prime support group on issues and policies related to equal opportunity. A group that includes comparatively large numbers of racial and ethnic minorities and political liberals, core catalysts see substantial inequality in society, are uncomfortable with it, and favor policies that address it across the board. Members of this group are well-positioned to be motivated to action.
While scoring high on every dimension used to create the clusters, core catalysts are particularly likely to perceive unequal treatment of groups as serious, to say they’ve personally experienced it, and to express willingness to take action on behalf of various groups. They’re most apt among all segments to have had regular personal contact with groups other than their own and are the most likely to think social conditions, not group behaviors, are mainly responsible for inequality.
One attribute, personal experience of unfair treatment because of one’s group, is especially important: It is one of the strongest and most consistent predictors of perceptions that unfair treatment that disadvantages groups is a serious problem and one of the strongest motivators of willingness to take action.
In terms of identity, core catalysts are among the two segments (along with ambivalents) most likely to consider a variety of their group-based personal characteristics as “essential” or “very important” to how they define themselves personally.5
5. Those who say one group membership is more, rather than less, important to their identity are more likely to say the same about other groups; in statistical terms, these items are correlated with each other significantly and positively. Indeed, an index constructed using all of the items assessing strength of identification has a Cronbach’s alpha of 0.9, out of a possible 0.0-1.0 range, indicating that all of the items are very closely related.
For example, 78 percent say their gender is highly important to them; 74 and 71 percent, respectively, say the same about their race and ethnicity, as do 65 percent about their sexual orientation, and 61 and 60 percent, each, about their class and political ideology.6
6. Fifty-seven percent of those in this cluster are women and 10 percent are non-heterosexuals; slightly more than the 52 and 6 percent, respectively, among all adults—not sufficient to explain the high importance of gender and sexual orientation to the identities of those in this group.
This is an important result because, as noted, the data show that strong group identification predicts perceptions of the perceived seriousness of unfair treatment of groups, support for anti-poverty efforts, and willingness to take action. Notably, potential advocates, the group described next, are least apt of all clusters to express strong group-based identities. For example, just 24 percent of potential advocates say their gender is highly important to them, and 11 percent each say the same for their race or ethnicity—54 to 63 points lower than among core catalysts.
Core catalysts lead all groups in personal efficacy, i.e., the feeling that they can personally effect change on issues they care about. Thirty-nine percent say they have a great deal or a good amount of ability to help change things for the better on issues important to them, the highest of all clusters and 15 points more than in the general population. They also are above average among the clusters, but less resoundingly so, in the extent to which they see groups as able to bring about change. Like all other clusters, they’re more likely to be interested in taking action on behalf of issues and groups they care about than to say they’ve in fact already done so.
Demographic characteristics: Fifty-one percent of core catalysts describe themselves as political liberals—nearly double the prevalence of liberals in other clusters—and 58 percent identify with the Democratic Party. In comparison, just 9 percent identify with the Republican Party; only 17 percent call themselves independent, 16 percent say they’re conservative, and 33 percent call themselves moderate. Among those who say they voted in 2012, eight in 10 report having supported Barack Obama, his most lopsided group.
It’s by far the most diverse cluster in terms of race and ethnicity; six in 10 are nonwhites, including 28 percent blacks, 23 percent Latinos, and 7 percent Asian American, while only four in 10 are white. Core catalysts also are more likely than others to be middle- to lower-income (48 percent earn less than $50,000 a year, while only 24 percent report $100,000-plus annual household incomes, among the lowest in any cluster). Not surprisingly, this is the only group in which most, 56 percent, say they’re less than “middle class.”
In line with the results on income, only 53 percent are employed, lower than in most other clusters; 13 percent are temporarily unemployed or looking for work, highest among clusters. (The rest are retired, 13 percent; not employed, 10 percent; or disabled, 10 percent.) Just 56 percent are homeowners, the lowest among all clusters. With a mean age of 44.7, they’re numerically among the youngest clusters (albeit not significantly different from the overall average age, 46.9) and include more millennials than most other groups. Fifty-seven percent are women, more than in most other groups, and just 41 percent of core catalysts are married, the fewest in any cluster.
Combining gender and marriage, this group contains the greatest percentage of unmarried women (34 percent) and the fewest married men (18 percent) of any cluster. Core catalysts also are more likely than average to include college-educated white women. Each of these is potentially important in election outcomes, as well as in the social policy issues addressed in this study.
Seventy percent of core catalysts call themselves Christian, as do 75 percent of all adults. Thirteen percent say they have another religious affiliation, numerically the most among all clusters, and 18 percent say they have no religion, the average among the clusters. Just 4 percent are evangelical white Protestants, numerically the fewest of any cluster. Forty-four percent of core catalysts say they attend religious services at least monthly, near the average of the clusters (40 percent).
In terms of their area of residence, 42 percent of core catalysts live in the South (numerically the most of all clusters) and 89 percent live in metropolitan areas, again a high; 23 and 20 percent reside in the West and Northeast, respectively, about the average among all adults. Just 15 percent live in the Midwest, the fewest to do so among all clusters; it’s 21 percent in the general population.
Core catalysts are the most active users of media to get information about politics. Sixty-four percent say they use TV to get information about political news and developments at least several times per week; 42 percent each say the same about using radio and the internet; and 35 percent say they read print newspapers that frequently. Fewer, just 28, 18, and 15 percent, respectively, say they use social media, blogs, or magazines for their political information needs that often, but those are still higher than they are among other clusters.
Attitudes and experiences: Core catalysts are the only cluster in which a majority says a limited number of groups in U.S. society (“just some” or “only a few”) have equal opportunities for success, one of many dimensions in which they see inequality.
While majorities in all clusters say it’s better when all groups have an equal chance, core catalysts are among the most apt to say so (nine in 10), with nearly three-quarters feeling that way strongly.
Correspondingly, people in this group are more likely than others to rank “equal treatment” as the single most important among five values tested in the study; 38 percent do so. They’re also more apt than average to say “compassion” is most important (24 percent) and by far the lowest of any cluster to rank “acting honorably” as first among values (23 percent).
Core catalysts’ value priorities are indicative of their ideological orientations and issue positions. As previous literature suggests, the fact that they prioritize equality and compassion over other values is crucial to understanding their social policy views.
Indeed, as noted previously, statistical modeling of the data from this study shows that these values independently predict the extent to which people perceive unfair treatment of groups as serious, as well as the extent to which they support policies intended to address issues such as poverty, criminal justice, and immigration. Moreover, perceptions of the seriousness of inequality predicts, in turn, willingness to take action on behalf of groups or social issues, further underscoring the importance of these basic values.
In terms of actual experience with unfair treatment, a central factor in attitudes about inequality, 62 percent of core catalysts say they’ve been treated unfairly at least sometimes because of their economic situation, 56 percent because of their race or ethnicity, and 52 percent because of their gender, making them the group most apt to have faced unfair treatment in some form. Further, 29 percent say they’ve been treated unfairly because of their English fluency, more than double the number in other groups.
Core catalysts also stand out for their level of personal efficacy. As noted, this is one of the most important predictors of the likelihood of taking action in this study. Four in 10 core catalysts feel they have at least a good amount of ability to make an impact on society, and they’re much less likely than average to think they can have little to no impact. Still, even if well above average, efficacy ratings in this group have substantial room to grow.
Basic orientations: Eight in 10 core catalysts are open to new ways of doing things, 10 points more than the rate among all adults, and six in 10 prefer to determine their own moral standards as opposed to following tradition. They’re the only cluster in which most reject the idea that there are inherent differences in intelligence among groups, as well as the only one in which a majority says everyone’s prosperity is linked, rather than chiefly an individual outcome.
Each of these views is tied to more support for the policies tested in this survey and greater willingness to take action.
Likely due to its greater proportion of minorities, this group is most likely, compared with other clusters, to say the group with which they identify most closely has things worse than other groups (28 percent say so, compared with no more than 14 percent in any other cluster). And, along with potential advocates, they’re least likely to think it’s acceptable if some groups have more opportunities in society than other groups (72 percent reject this inequality), including 38 percent, a high, who find it not acceptable at all.
Preferences: On specific policies, core catalysts are the most likely to support a path to citizenship for undocumented immigrants (77 percent do so), among the most apt to prefer rehabilitation rather than stricter punishment in the criminal justice system (61 vs. 39 percent), and the only group in which majorities favor expansion of tax deductions on mortgages (55 percent) and tax breaks for building affordable housing (62 percent) and say that laws to prevent discrimination in housing are too weak (52 percent).
In terms of efforts to reduce poverty, compared with other clusters, this group is most apt to place a high priority on improving public education (91 percent), increasing the minimum wage (77 percent), holding down student loan interest rates (75 percent), increasing funding for job training (71 percent), and spending more on infrastructure (58 percent). Those in this cluster also are the most likely to favor increasing funding for loans for low-income students (69 percent), school lunches (67 percent), food stamps (55 percent), and unemployment benefits (49 percent); to support alternative sentencing in the judicial system (63 percent); and to support policies that help formerly incarcerated individuals (job training and tax incentives for hiring them, 85 and 72 percent, respectively).
Action: As noted, core catalysts stand out for their willingness to take action on many fronts. The number saying they’d get involved or already are peaks for action on behalf of poor people (95 percent), women and black women (94 and 88 percent, respectively), Native Americans (84 percent), and Latinos and black men (83 percent each). Fewer, only 65 to 71 percent, say they’d take action to improve opportunities for undocumented immigrants, gays and lesbians, Asian Americans, and the formerly incarcerated, the highest of all clusters.
Similarly, large numbers of core catalysts—the highest rate among the clusters—say they’d be likely to get involved (or already are involved) in encouraging equal opportunity for all groups (94 percent), reducing poverty (93 percent), improving criminal justice for minorities (85 percent), and providing a path to citizenship for undocumented immigrants (77 percent).
Just 53 percent say the same of taking action on securing the U.S. border with Mexico, the only action on which other groups (skeptics and resistants alike) score higher.
Core catalysts also are the most likely across clusters to say they would (or already do) undertake a variety of specific actions to support a cause. Nonetheless, as is common across clusters, rates are higher for actions that require less effort, such as talking with others about their views (95 percent say they’d be likely to do this, including those who already do so) and signing a petition (89 percent). Fewer say they’d boycott products or vendors or volunteer (82 percent each), donate money (80 percent), contact elected officials (78 percent), engage in creative projects to bring attention to issues (73 percent), write or post something online or in print (70 percent), or participate in protests (63 percent).
In terms of their current participation in community organizations, core catalysts largely match the average across clusters. Twenty-three percent say they are in a religious group; 15 percent in a neighborhood association; 14 percent in a hobby, sports, or youth group; and 11 percent in a school club or association. (Their participation rates in other organizations are in the single digits.)
Fifty-two percent of core catalysts say they gave money to a charity in the past year, 21 percent attended a community group meeting, and 18 percent donated blood, the highest across clusters. Just more than a quarter (27 percent) worked for a charity or church, about average across clusters. Few have taken any specific civic action in the past year, and though their participation rates are highest among the clusters, they exceed single digits for only the following: contacting a government official (19 percent), giving money to a presidential campaign (15 percent) or to another political candidate (12 percent), working with others in the community on a problem, or commenting about politics on a message board or the internet (13 percent each).
Potential advocates
Potential advocates, 18 percent of adults, are more similar than any other group to core catalysts attitudinally, and they broadly support policies to address inequality. But they are a very different slice of society: They include disproportionate numbers of white liberals and, compared with core catalysts, are better off financially, much less likely to have experienced unfair treatment because of group membership, and less confident that they can have an impact by taking action.
As such, this group is less intense, as detailed in the following, in the views that it shares with core catalysts, lacking the heightened levels of commitment and motivation that appear to stem both from personal experience of unfair treatment and feelings of personal efficacy.
As noted, in one important difference, potential advocates are the cluster least likely to describe their own race, ethnicity, gender, class, political ideology, or other characteristics as “essential” or “very important” to their personal identity. Only 8 to 24 percent do so, compared with 60 to 78 percent of core catalysts.
Specifically, just 8 percent of potential advocates say their sexual orientation is highly important to them, and only 11 percent each say the same about their race or ethnicity. Also, few say their political ideology (14 percent), national origin (15 percent), economic class (16 percent), or religion (19 percent) are particularly important to them. Across these group-based identity dimensions, gender is endorsed most often by potential advocates as being highly important (24 percent).
The regression analyses reported previously find that stronger identification with one’s groups overall is strongly related to perceived seriousness of unequal treatment, support for related policy issues, and willingness to take social action. Therefore, the lack of group identification among potential advocates is a potential impediment to their taking a more active role in social issues.
But there are countervailing forces. Potential advocates are much more likely than Americans overall to attribute group inequalities to social conditions rather than to group members’ behaviors—an attitude that is among the strongest predictors in this study of support for anti-poverty measures, a path to citizenship for undocumented immigrants, and changes in criminal justice policies, as well as a main predictor of willingness to act to reduce group inequalities. Indeed, potential advocates are notably willing to take specific actions on behalf of others, as well as to perceive unequal treatment of groups as a serious problem.
Members of this group, in sum, are primed to support social policies aimed at improving conditions for others and appear likely, in particular, to respond positively to involvement opportunities that show a clear path linking action with outcomes.
Demographic characteristics: Potential advocates include about as many liberals as core catalysts (46 and 51 percent), and follow core catalysts with the second-highest prevalence of Democrats, 44 vs. 58 percent. Seven in 10 potential advocates who voted in 2012 supported Barack Obama.
Those are similarities; among differences, three-quarters of potential advocates are white, compared with only 40 percent of core catalysts; potential advocates include many fewer blacks and Latinos (just 8 and 11 percent, respectively). Four percent are Asian American.
Potential advocates are less apt than core catalysts to earn less than $50,000 a year (37 percent) or to say they’re less than middle-class (45 percent), as well as more likely to own a home (73 percent). Thirty-four percent in this cluster are college graduates, somewhat higher than average among the clusters, and they’re comparatively low in religious service attendance. (As noted, a higher level of religiosity predicts willingness to take action.)
Just 28 percent of potential advocates say they attend religious services at least monthly, the fewest to say so among all clusters. Sixty-nine percent are Christians, numerically the lowest among all clusters; 6 percent are affiliated with another religion, while 25 percent say they have no religious affiliation, matching the disengaged as the highest among clusters.
While core catalysts include more women than men and are a bit younger than others, potential advocates are split nearly evenly between the sexes and are about average among the clusters in age (47.8). They are 14 points more likely than core catalysts to be married.
Geographically, a plurality of potential advocates (36 percent) lives in the South, while the rest are divided among the Northeast (21 percent), Midwest (20 percent), and the West (23 percent). Eighty-eight percent live in metropolitan areas, similar to the norm.
Potential advocates are near average among the clusters in their media consumption for political information. Fifty-three percent of them say they watch TV for this purpose at least multiple times a week, and one-third each say they read print newspapers, use the internet, or listen to the radio that frequently. Many fewer frequently get their political information from magazines, blogs, or social media (just 7, 8, and 12 percent, respectively).
Attitudes and experiences: While not as high-scoring as core catalysts, potential advocates are more apt than those in other clusters to see unequal treatment that disadvantages some groups as a problem. Half think only some or just a few groups have an equal opportunity to succeed.
As noted, there’s a key difference in this group compared with core catalysts in personal experience: The numbers who’ve experienced unfair treatment based on their own race, income, or sex are 36, 33, and 28 points lower, respectively.
Nonetheless, potential advocates stand out for the extent to which they perceive unequal treatment even while being much less likely to have experienced it personally, a view that fits with their politically liberal views of social structure.
For example, 90 percent of potential advocates say unequal treatment that disadvantages poor people is a very or somewhat serious problem, second-most to core catalysts (96 percent). Also second only to core catalysts, most say that unequal treatment is a problem for black women and men (77 and 75 percent say so), Native Americans (75 percent), gays and lesbians (72 percent), undocumented immigrants (71 percent), Latinos (70 percent), women (69 percent), and previously incarcerated individuals (68 percent).
Another important difference is that, as noted, potential advocates are comparatively low in personal efficacy: Only 14 percent feel they have at least a good amount of ability to help change things for the better on issues important to them, compared with 39 percent of core catalysts. Indeed, 46 percent of potential advocates feel little to no ability to change things, placing them among the lowest in all clusters (along with ambivalents and the disengaged) in personal efficacy. Given the strong relationship between efficacy and action in the regression models, this lack of personal efficacy is an obstacle to greater action for potential advocates.
There’s also a sense of privilege among potential advocates: This is the only one of the six clusters in which a majority thinks the group that they identify with most strongly has things better than others. That sense, coupled with their sensitivity to group inequalities, may fuel an ethos of altruism that can be tapped.
Basic orientations: Like core catalysts, nine in 10 potential advocates believe society is better when everyone has an equal chance, though fewer, six in 10, feel that way strongly. They are similar to core catalysts in ranking “treating everyone equally” or “compassion” prominently among basic values (31 and 19 percent, respectively). Three-quarters call it unacceptable for some groups to have greater opportunity than others. Two-thirds prefer to determine their own morality than to follow tradition, and eight in 10 express openness to new ways of doing things overall. These views predict higher support for policy proposals on poverty, immigration, and criminal justice.
This cluster divides exactly evenly on whether or not there are inherent differences in ability among groups, the only group other than core catalysts in which half or more do not believe some groups of people are more intelligent than others. And although most (57 percent) think each person is responsible for his or her own prosperity, as opposed to believing in linked fate, that’s the second lowest among groups.
Policy preferences: Potential advocates are second only to core catalysts in their support for an active policy agenda on several issues explored in this study. They’re more supportive than average among clusters of increasing funding for a variety of anti-poverty programs, including unemployment benefits (34 percent), food stamps (37 percent), and school lunches (50 percent); place a greater priority than most others on raising the minimum wage in an effort to reduce poverty (62 percent); and more broadly favor a path to citizenship (68 percent).
Further, other than core catalysts, potential advocates are the only group among whom a majority supports a focus on rehabilitation rather than punishment in the criminal justice system.
On some other policies, though, this cluster is more in the mid-range. These include support for anti-poverty policies such as improving public education, expanding government-funded job training, increasing infrastructure spending, and protecting Social Security, as well as in their views on expanding tax deductions on mortgages.
Action: Potential advocates are average among clusters overall in terms of their likelihood of taking action on behalf of groups. Majorities say they’d be likely to take action to improve opportunities (or already do so) for only about half of the groups asked about in the survey—the poor (77 percent), women (70 percent), Native Americans (55 percent), black women (53 percent), and gays and lesbians (also 53 percent).
Still, on issues, potential advocates are second highest, after core catalysts, in their stated likelihood to take action to reduce poverty (82 percent, including the few, 2 percent, who already do this) and to create equal opportunities for all groups (79 percent). Fewer, 54 percent, say they’d take action to improve criminal justice for minorities, but that is greater than average among clusters.
Seventy-seven percent say they’d talk with others (or already do so) on behalf of issues or groups important to them, 74 percent say they’d sign petitions, 61 percent would boycott products or vendors, 55 percent would make monetary donations, and 49 percent would volunteer their time.
Few potential advocates actively participate in community organizations; 14 percent are in hobby, sports, or youth groups, and 12 percent are in a neighborhood association or community group, about average among clusters. Just 13 percent are in a religious group, numerically the lowest among all clusters. Membership in other organizations is in the single digits.
Their monetary donations to charities (47 percent), charity work (22 percent), participation in community meetings (18 percent), blood donations (13 percent), and involvement in PTA or school group meetings (11 percent) are at or very near average across the clusters. Even fewer say that in the past year they’ve been involved in specific civic and political activities such as giving money to a political candidate, contacting a government official, or participating in a political movement—one in 10 or fewer for each of the 11 items tested.
Ambivalents
Ambivalents, 22 percent of the adult population, express competing concerns. In some ways, such as perceptions of inequality of opportunity, they look more like core catalysts and potential advocates. In others—traditionalism and a stress on loyalty, for example—they look more like skeptics and the disengaged.
Ambivalents are about average in how seriously they see unfair treatment that disadvantages groups, in their interest in taking action to improve opportunities, and in their willingness to engage in a range of specific actions. But there are instructive differences: Ambivalents feel their own group-level identities more strongly than most others do. Eighty-four percent, for example, say their gender is essential or very important to their personal identity, and 71 to 74 percent say the same about their national origin, race, ethnicity, religion, and sexual orientation.
These individuals are among the least apt of the clusters to think different groups can take action to improve their situation—group efficacy. Just 12 percent say poor people have a great deal or a good amount of ability to change things on issues important to them, compared with 39 percent of core catalysts. Ten percent of ambivalents say the same for undocumented immigrants, compared with 36 percent of core catalysts; and just 37 percent say blacks have substantial ability to change things vs. 66 percent of core catalysts.
Ambivalents also are on the lower end among clusters in thinking they can personally have an impact; just 17 percent say so vs. 39 percent of core catalysts. They’re also less likely, in stark comparison to core catalysts, to have had recent personal interactions with other groups. These characteristics likely decrease their willingness to get involved.
Demographic characteristics: Ambivalents are a mixed group, resembling the nation’s population overall on a variety of measures. Thirty-five percent identify as Democrats, and a quarter each identify as Republicans and independents. A quarter are liberals, 39 percent moderates, and 37 percent conservatives. Half voted for Barack Obama in 2012, and half for Mitt Romney.
The cluster is two-thirds white, again average (66 percent of adults overall are non-Latino whites). Fourteen percent of ambivalents are Latino, 12 percent black, and 5 percent Asian American. This group also is close to the nation’s population overall in self-assessed economic class and marital status.
There are some differences. Ambivalents are older than others—the only group with an average age greater than 50. Six in 10 are women, numerically the highest of all groups. They’re less likely to be employed and numerically more likely than other clusters to be retired, 22 percent.
Also, 85 percent of ambivalents are Christian, more than in any other group save resistants, and 15 and 16 points higher, respectively, than among core catalysts and potential advocates. Just 9 percent say they have no religious affiliation, lowest among the clusters, and 16 percent are evangelical white Protestants, second only to resistants. Forty-five percent say they attend religious services at least monthly, slightly more than among all adults (40 percent).
Geographically, ambivalents closely mirror the country overall; 37 percent live in the South, 24 percent in the Midwest, and 19 and 20 percent each in the Northeast and the West. Eighty-two percent reside in metropolitan areas, about average for all Americans.
Among media channels, ambivalents report using TV the most for political information; 62 percent say they watch it at least several times a week. About three in 10 ambivalents say they listen to the radio, use the internet, or read print newspapers that frequently for information about politics; fewer report frequently using social media (14 percent) or reading magazines or blogs (7 percent each) for political information—near the average across groups in each case.
Attitudes and experiences: Similar to core catalysts and potential advocates, about nine in 10 ambivalents believe it’s better when everyone has an equal chance, and six in 10 feel that way strongly. But unlike those other two groups, a clear majority of ambivalents (59 percent) also think equal opportunities currently are available for at least a good number of groups.
Two-thirds in this cluster frown on inequality of opportunity, compared with 34 percent who find it at least somewhat acceptable. That’s a higher tolerance for inequality than is found among potential advocates and core catalysts but much less than in other groups. This is important because, as detailed previously, regression modeling finds that seeing inequality of opportunity among groups as acceptable predicts a disinclination to take action on social issues.
Interestingly, other than core catalysts, ambivalents are most apt to say they’ve been treated unfairly based on their group-level characteristics. That may reflect the relative preponderance of women and lower-income earners in this cluster. It’s another revealing result, given the role of experience of inequality in perceptions and willingness to act.
Basic orientations: Seven in 10 ambivalents think individuals are responsible for their own success, and far fewer see a “linked fate” between individual and overall prosperity than do core catalysts or potential advocates—a perception that predicts willingness to take action. Additionally, 64 percent of ambivalents believe there are inherent differences among groups in aptitude, significantly more than hold this view among potential advocates (50 percent) or core catalysts (46 percent).
Moreover, people in this cluster are similar to skeptics and the disengaged when it comes to the importance of tradition; 32 percent of them say they prefer tradition over trying new ways of doing things, vs. 19 and 18 percent among core catalysts and potential advocates, respectively.
Ambivalents also are similar to skeptics and the disengaged groups in ranking values, with “acting honorably” on top in each of these groups (ranked first by 32 percent of ambivalents), followed by equal treatment (24 percent). In contrast, core catalysts rank equal treatment as their top value (38 percent), followed by compassion (24 percent).
Moreover, personal efficacy is low among ambivalents. Just 17 percent feel they can have a great deal or good amount of impact on issues important to them, similar to potential advocates and the disengaged (14 percent, each).
Policy preferences: At the same time, on most policies, ambivalent individuals look similar to potential advocates, with an exception: Given their views on personal responsibility, a majority (56 percent) in this cluster focuses on punishment over rehabilitation in the criminal justice system. That’s close to the average among all groups but higher than among core catalysts or potential advocates.
Action: Overall, ambivalents’ willingness to take action on behalf of groups peaks for poor people (73 percent) and women (70 percent) and drops for Native Americans (45 percent), black women (41 percent), and Latinos (36 percent). One-third or fewer are willing to take action for black men and Asian Americans, and it’s lower for remaining groups. These roughly match the averages among clusters.
In terms of issues, ambivalents’ likelihood to get involved peaks for efforts to reduce poverty (80 percent say they would take action), roughly matching potential advocates and lower only than core catalysts. Seventy-one percent say they’d act to encourage equal opportunities for all groups, while fewer than half say they’d participate in efforts to improve criminal justice for minorities or secure the U.S.—Mexico border, close to the average across clusters. Just a third of ambivalents say they’re likely to get involved in efforts to provide a path to citizenship, significantly below the overall average and trailing core catalysts, potential advocates, and skeptics alike.
Ambivalents are lower than average among the clusters in their likelihood to say they’re willing to take specific actions. On the high end, 68 percent say they’d talk to others about their views and 62 percent say they’d sign petitions. Just 49 and 48 percent, respectively, say they’d boycott products or donate money. Rates fall further for contacting elected officials or volunteering (39 percent each) and bottom out with protesting (17 percent).
In measures of current engagement, ambivalents, again, are average among the clusters. Just 23 percent belong to a religious group and 12 percent to a hobby or sports group. One in 10 each attended a PTA meeting or a community group meeting or donated blood in the past year. A quarter have worked for a charity or church, and half have given money to a charity.
Like other clusters, relatively few ambivalents have engaged in civic activities in the past 12 months. Eleven percent have contacted a government official, the most of any activity measured, and practically none (not exceeding 2 percent) actively participate in any political movements.
The Disengaged
Disengaged individuals, 14 percent of the population, stand out for their relative lack of interest and involvement in politics, limited first-hand experience with unfair treatment, and lowest level of personal efficacy among all groups.
This population is challenging to motivate and generally comfortable with the status quo. While not actively opposed to efforts to address inequality of opportunity, they’re also not highly likely to pay much attention to politics or public policy, let alone to get involved.
Although the disengaged have only slightly below-average scores on perceptions of the seriousness of unequal treatment, they are far less likely than all other clusters to say they’d take action to help various groups. One reason is that they’re slightly above average (compared with other clusters) in their inclination to attribute groups’ inequality to their own behavior, rather than to social conditions. As noted, this strongly predicts opposition to various social policies and a reduced likelihood to take action.
The disengaged also are slightly less likely than average among the clusters to think that groups have a great deal of ability to change things, are among the three clusters least apt to say they can personally make a difference, and are much less likely to have had personal contact with a diverse mix of people.
In terms of strength of identification with the groups to which they belong, the disengaged are on the lower end of the spectrum, with only 21 to 38 percent saying each of the attributes, from race to national origin, is essential or very important to them. That compares with a range of 60 to 78 percent among core catalysts.
Specifically, 38 percent of the disengaged say their gender is highly important to how they think about themselves, compared with 84 percent among ambivalents, 78 percent among core catalysts, and 75 percent among resistants. Thirty-three percent say the same about their religion, and 31 percent each say national identity and race are highly important, again among the lowest of all clusters. Just a quarter say their ethnicity, economic class, and sexual orientation are at least very important to who they are, and 21 percent say the same about their political ideology.
Demographic characteristics: The disengaged differ from other clusters in several crucial ways. Six in 10 are men—the most of any group, and much higher than average—including 31 percent who are unmarried men, again the greatest proportion of any group.
Eight in 10 are white, more than in most groups, with just 4 percent Asian Americans, 6 percent blacks, and 8 percent Latinos. That’s fewer nonwhites than among potential advocates, skeptics, and ambivalents alike, and much fewer than among core catalysts. Among whites, moreover, the disengaged include the highest proportion of men without college degrees (44 percent).
The disengaged are most likely of all groups to say they have no preference in political parties, least likely to say they voted in the last presidential election, much less likely than others to be Democrats, least likely to be liberals, and most likely to identify themselves as moderates.
In terms of religion, 71 percent are Christians (similar to core catalysts, potential advocates, and skeptics), 4 percent are affiliated with another religion, and a quarter have no religious affiliation; the latter matches potential advocates as the highest among clusters. The disengaged also are low (along with potential advocates) in religious service attendance, with just 30 percent saying they attend religious services at least monthly and 35 percent saying they never attend.
The disengaged are in the middle of the pack in age, income, perceived socioeconomic status, and employment. Geographically, 27 percent live in the Midwest, among the highest across clusters, and 28 percent live in the South, lowest among all clusters. Twenty-four percent live in the West, about average, and 21 percent in the Northeast, numerically the highest among clusters along with potential advocates. Eighty-four percent reside in metropolitan areas, again average.
Underscoring their apathy, the disengaged are the lowest among all clusters in terms of frequent use of media channels for political news. Barely half, 49 percent, say they watch TV at least several times a week to get political information. It’s even lower for other media channels; just 29, 28, and 23 percent, respectively, say they listen to the radio, use the internet, or read print newspapers that frequently for political news. Numbers drop even further for use of social media (13 percent), blogs (7 percent), and magazines (5 percent) for political information.
Attitudes and experiences: Although 83 percent of the disengaged say equal opportunity is better for society than having some groups on the top and others on the bottom, only 42 percent think so strongly, numerically the lowest among all clusters and similar to resistants. The disengaged also are more likely than average to perceive equality among groups; for example, 69 percent think American society offers equal opportunities for “at least a good number” of groups, compared with just 43 percent among core catalysts and 51 percent among potential advocates.
Lack of personal experience with unfair treatment, which in this study strongly predicts how serious of a problem group inequalities are perceived to be, also is a likely contributor to this group’s comparative detachment from politics and lack of engagement. They’re numerically the least likely of the groups to say they’ve been treated unfairly on the basis of their race, economic class, or gender.
Another potential contributor is the fact that the disengaged report the least amount of personal efficacy of any group. Fifty-four percent feel they can have little to no impact on issues that matter to them. That includes 21 percent who think they can’t affect things at all, at least twice as high as in any other group. Only 14 percent feel they can have at least a good amount of influence on issues, compared, for example, with a peak of 39 percent among core catalysts.
Basic orientations: Notably, 79 percent of the disengaged think individuals are responsible for their own success, and a substantial minority (44 percent) finds unequal opportunity among some groups at least somewhat acceptable. Those views discourage activism; they’re significantly higher among the disengaged than among core catalysts, potential advocates, and ambivalents alike.
Similar to most other clusters, the disengaged rank “acting honorably” first among moral values (four in 10 do so) and equal treatment of others next (23 percent). They divide evenly between preference for traditional vs. individual standards of morality, similar to the average across groups. And although they tilt toward new ways of doing things (preferred by six in 10) vs. following tradition in general, this margin is slimmer than in other groups aside from resistants.
Policy preferences: As the name implies, the disengaged are lukewarm, at most, toward policy initiatives on issues of equality of opportunity and discrimination. They’re also among the least likely of all groups to place a high priority on issues such as holding down student loan interest rates (52 percent) or providing government-funded job training (28 percent) to reduce poverty, among others.
Most prefer no change on funding for food stamps or tax breaks on housing (56 percent each) or funding for school lunches (60 percent). Majorities oppose reforms to help formerly incarcerated individuals, including job training (51 percent) and tax incentives to hire adults who were previously incarcerated (55 percent). Similarly, a majority (55 percent) opposes providing a path to citizenship for undocumented immigrants. And the disengaged broadly favor punishment over rehabilitation in the justice system, 63 vs. 36 percent, 9 points more than in the population overall.
Action: As noted, the disengaged are lowest among all the clusters in terms of their likelihood to get involved. Fewer than 10 percent say they’re likely to take action on behalf of any of the groups asked about, peaking for action on behalf of the poor, at 9 percent, and women, at 7 percent. On specific issues, just one in 10 say they’d be likely to get involved to reduce poverty, to encourage equal opportunities for all groups or secure the border with Mexico; even fewer say the same for other issues.
Indeed, just 22 percent of the disengaged say they’re likely to take action on behalf of any of the issues or groups tested, and most of these are unwilling to commit to any specific civic action.
Just 4 percent are willing to talk with others, 3 percent are willing to boycott a product or vendor, and 2 percent each are likely to donate money or sign a petition. Practically none of the disengaged say they would do any other of the actions listed (e.g., protesting or contacting an elected official).
In terms of civic and political engagement, disengaged individuals also are on the low end of all clusters. Just 14 percent belong to a religious group and 12 percent to a hobby, sports, or youth group. In the past year, 9 percent have contacted a government official, 17 percent have worked for a charity, and 35 percent have donated to a charity. Nearly none actively participate in a political movement.
Skeptics
Skeptics, 17 percent of the public, are not inclined toward policy initiatives on issues of equality of opportunity and discrimination. But they’re not as adamantly opposed to it as their resistant counterparts. Though by no means a core constituency on the issues addressed here, there are some specific policies to which skeptics are more receptive. They’re also younger and less settled in terms of major life experiences such as marriage and home ownership than resistants and less likely to be firmly set in their attitudes.
Members of this segment are below average among the clusters in their perceptions of the seriousness of group-level inequalities overall but higher than resistants. In one example, unequal treatment of black men is considered a serious problem by 34 percent of skeptics compared with 87 percent of core catalysts but just 12 percent of resistants. Similarly, 42 percent of skeptics think unequal treatment experienced by undocumented immigrants is a serious problem, compared with 82 percent of core catalysts and 25 percent of resistants.
Skeptics fall well below core catalysts in their intention to act on behalf of different groups, but still express greater willingness to act (or say they already do so) than resistants. For example, 70 percent of skeptics say they’d be likely to get involved on behalf of women (compared with 94 percent of core catalysts and 40 percent of resistants); 51 percent say the same about black women and 45 percent about black men.
Still, on willingness to take specific actions on behalf of an issue or group, skeptics tend to score higher than the population overall, and they’re slightly more likely than average to have had personal interactions with a variety of groups, the most important predictor of action in statistical modeling of the data.
While they perceive more-than-average group efficacy to change things, skeptics also are slightly more likely than average to think groups’ behaviors are more responsible than social conditions for the inequality they experience—as noted, a view that predicts opposition to social policies and reduced likelihood of action.
Like the disengaged, skeptics are on the lower end of the spectrum in terms of the importance they ascribe to their group memberships, such as their race or gender. For example, 39 percent say their gender is essential or very important to who they are, and 37 percent say the same about their religion. Just 21 and 23 percent each say their race or ethnicity is highly important to how they think about themselves. Similarly few say the same about their sexual orientation (28 percent), their political ideology (21 percent), or their economic class (20 percent).
Demographic characteristics: Skeptics lean conservative, albeit much less so than resistants (40 vs. 64 percent). Relatively few skeptics identify with the Democratic Party (22 percent); instead they’re closely split between Republicans (30 percent) and independents (27 percent, numerically the highest among all groups). Those who voted did so for Mitt Romney by a 20-point margin.
Skeptics are not as strongly conservative as resistant individuals, which is partly related to their demographic differences; 68 percent of skeptics are white, compared with 82 percent of resistants, with nonwhites nearly twice as prevalent. Nineteen percent are Latino, 6 percent are Asian American, and 5 percent are black. Skeptics also are 15 points less likely than resistants to be Christians (72 vs. 87 percent). Just 6 percent of skeptics identify with a non-Christian religion, while 21 percent say they’re not affiliated with any religion; 12 percent are evangelical white Protestants and 45 percent say they attend religious services at least monthly. All these are about average across the clusters.
With an average age of 44.3, skeptics are numerically the youngest of all groups (albeit not significantly different from core catalysts). Along with core catalysts, they include a greater proportion of millennials (a quarter of both groups, vs. 19 percent of all others). It follows that, compared with resistants, they’re 15 points less apt to be married and 13 points less likely to own a home.
A plurality of skeptics live in the South (39 percent, nearly average among clusters), with 15 and 18 percent each in the Northeast and Midwest. Twenty-eight percent live in the West, the highest of any cluster. Eighty-three percent live in metropolitan areas, average across clusters.
Skeptics are about average across clusters in their use of media for political information. Fifty-one percent say they watch TV for this purpose at least several times a week, dropping to 34 percent for the internet, 33 percent for radio, and 28 percent for print newspapers. Just 15 percent say they use social media for political news that often, and 8 and 6 percent, respectively, say the same for blogs and magazines.
Attitudes and experiences: Other than resistants, skeptics are the only group in which a majority (53 percent) currently sees equal opportunity for all or most groups in this country—but they feel less strongly about it. In addition, 47 percent see inequality of opportunity as at least somewhat acceptable, compared with 37 percent of all adults and 26 percent of potential advocates. Seventy-nine percent see individuals as responsible for their own success.
Basic orientations: Like the disengaged, skeptics divide evenly on whether traditional or self-developed morality is best. They’re close to the average among all Americans on most other basic orientations: Eight in 10 think it’s better when everyone has an equal chance to succeed, seven in 10 are open to new ways of doing things in general, and six in 10 think some groups are inherently smarter than others. Also, as in the general population, “acting honorably” emerges as the most important moral value, followed by equal treatment of others.
Policy preferences: Skeptics have a mix of policy views, with a tendency toward preserving the status quo. Half think tax breaks in housing are at the right level already. In terms of anti-poverty efforts, this group roughly matches the average across all clusters in terms of prioritizing improving public education (77 percent), holding down student loan interest rates (60 percent), increasing infrastructure spending (46 percent), and cutting business taxes to create jobs (45 percent). But skeptics are less likely than Americans overall to put a high priority on avoiding Social Security cuts (57 percent), increasing the minimum wage (38 percent), or spending more on government job training (37 percent) in order to reduce poverty.
Majorities resist change in current spending on unemployment benefits (57 percent think spending should stay the same), loans for low-income students (51 percent), school lunches (58 percent), and food stamps (54 percent.) As with other mid-range clusters, skeptics tend to prioritize punishment over rehabilitation in the criminal justice system (56 to 43 percent), though less broadly than the disengaged and resistants.
Action: Skeptics are slightly above average in their likelihood to take action to improve opportunities across a range of groups. Three-quarters say they’d be likely to get involved on behalf of poor people (or already are), and 70 percent say the same about women. As with Americans overall, skeptics are least apt to be willing to get involved to help undocumented immigrants (37 percent) and those who have been previously incarcerated (34 percent). Forty-three to 55 percent say they’d be likely to engage on behalf of other groups.
On issues, matching potential advocates, eight in 10 skeptics say they’d get involved to reduce poverty in them United States or to encourage equal opportunities for all groups. And 50 percent, near the average across clusters, say they’d get involved to improve the criminal justice system for minorities and 42 percent say the same for providing a path to citizenship. Willingness to engage to help secure the border with Mexico is particularly high among skeptics; 64 percent say they’d work on this issue, a number exceeded only by resistants.
Skeptics are near the higher end of the clusters in terms of their likelihood of taking a variety of specific actions on behalf of a group or issue. For example, 79 percent say they’d talk to others (or already do so); 73 percent would sign petitions; and about six in 10 each would boycott products or vendors, volunteer, donate money, or contact elected officials. Rates plummet for other activities, including protesting, which only 31 percent say they’d do.
Just about matching the average across clusters, 21 percent of skeptics currently participate in a religious group; 15 percent in a hobby, sports, or youth group; and 9 percent in a neighborhood or community group. In the past 12 months, 54 percent have given money to a charity, a quarter have worked for a charity or church, and about one in eight have donated blood or attended a community or a PTA meeting. Apart from contacting a government official (14 percent), engagement in other civic or political activities or participation in movements doesn’t reach 10 percent for any activity or organization tested.
Resistants
The basic values of traditionalism and individuality among resistant individuals, 10 percent of the population, inform their ideological opposition to social policies to address inequality. The most politically conservative of the groups, resistants don’t see much inequality or discrimination in society, in effect rejecting the premise that there’s a problem to address.
Being unlikely to perceive unfair treatment of groups as a serious problem, this group clearly is not inclined to take action to assist various groups. Instead, resistants are much more likely than average to attribute any group inequality to behaviors of the groups in question, rather than to social conditions. They also score comparatively high in the belief that groups can do a lot to change things—views that, in combination, may leave them particularly unlikely both to see and to be willing to act on structural and group-based inequalities.
Resistants, further, are less likely than average to say they themselves have been treated unfairly on the basis of their group memberships, even while they’re above average in the extent of their group-based identifications.
Overall, those in this group tend to ascribe high personal importance to their group memberships at levels similar to core catalysts (although the demographic groups to which they belong tend to be higher in status). Seventy-five percent see their gender as essential or very important to who they are, 73 percent say the same about their religion, and 68 percent each about their national origin and sexual orientation. Sixty-five percent say their race is that important to them personally, as do 60 percent about their political ideology, 58 percent about their ethnicity, and 53 percent about their economic class.
Demographic characteristics: This cluster is overwhelmingly the most conservative in their ideological self-descriptions (64 percent identify as conservative, at least 24 points more than any other group) and they are the most apt to identify with the Republican Party (51 percent do). Among those who voted in the 2012 presidential election, three-quarters backed Mitt Romney.
Resistants include numerically the largest proportion of whites of all groups (82 percent) and therefore the fewest minorities, with only 3 percent blacks, 6 percent Latinos, and 7 percent Asian Americans. Along with the disengaged, among whites, resistant individuals are most apt to be men without a college education (four in 10). And overall just 22 percent in this cluster have a college degree, numerically the fewest of any of the six groups.
Fifty-four percent in this cluster are men, on the higher side among the clusters; 72 percent are married, well beyond any other group (and 15 points more than the closest), and homeownership rates are the highest of any cluster (85 percent). Resistants also include the highest and lowest proportions of married men (37 percent) and unmarried women (11 percent), respectively, exactly opposite the pattern among core catalysts.
Residency in metropolitan areas is numerically the lowest (76 percent) of all clusters. Few resistants live in the Northeast (just 11 percent vs. 18 percent among all adults), with more than average in the Midwest (30 percent vs. 21 percent overall); these rates are the lowest and highest of all clusters, respectively. The remaining 39 percent live in the South and 20 percent in the West, about the rates in the general population.
There are more Christians in this group than in most others (87 percent); a quarter of resistants are evangelical white Protestants, compared with only 11 percent overall and no more than 16 percent in any other cluster. Resistants also are more apt to be highly religious; 49 percent in this cluster say they attend religious services at least monthly, the highest of any cluster and higher than among all adults (40 percent).
Resistants are about average among the clusters in their media use for political information. Fifty-seven percent say they watch TV at least several times a week to get political news and information, while 37 percent listen to the radio and 32 percent use the internet. As with all other clusters, rates are lower for social media (18 percent), blogs (7 percent), and magazines (6 percent).
Attitudes and experiences: Six in 10 in this group think the U.S. offers equal opportunities to at least most groups, with four in 10 saying there is equal opportunity for all, far more than in other clusters. Although majorities across all clusters say equal opportunity for all is better for society, the number saying so is lowest in this group, 68 percent.
Just half of resistants say inequality of opportunity among groups is not so acceptable or not at all acceptable, fewer than in other groups. Half (50 percent) find inequality is at least somewhat acceptable. As mentioned, this view predicts opposition to policy initiatives measured in this survey and unwillingness to take action.
Resistants align with most others—specifically, the disengaged, skeptics, and potential advocates—in reporting that they’ve personally experienced little to no unfair treatment because of their group memberships. As noted, those who have not personally experienced unfair treatment are less likely to think inequality among groups is a serious problem.
Basic orientations: Nine in 10 resistants believe that individuals are responsible for their own prosperity, a peak among clusters. They’re also the most apt to believe that the best frequently rise to the top (34 percent say so) and that some groups are inherently smarter than others (seven in 10 hold this view, with three in 10 saying they’re sure of it—more than in any other cluster).
Individuals in this group have some different value priorities than others. Nearly half say “acting honorably” is the most important value of those tested, while 22 percent cite “loyalty to your country.” Both are peaks among clusters. It’s also the only cluster in which a clear majority (61 percent) favors following traditional morality and in which there’s a division, 48 to 52 percent, in preference for following tradition vs. trying new things.
Policy preferences: Resistant individuals are least supportive of most policies tested in this survey and put a lower priority on taking action. Seven in 10, for example, oppose a path to citizenship, half want funding for food stamps decreased, and a majority opposes programs for formerly incarcerated individuals. This cluster is the most apt to prefer stricter punishment over rehabilitation in the justice system (eight in 10), with seven in 10 holding that opinion strongly, 28 points beyond the next closest group.
There are some exceptions in which resistants are closer to others in policy views. For example, they’re as supportive as most other groups of expanding tax deductions on mortgages and two-thirds think Social Security cuts should be avoided; in terms of efforts to reduce poverty, 57 percent want to prioritize holding down student loan interest rates and seven in 10 think improving public education should be a high priority. They’re also at the top, along with core catalysts, in placing a high priority on cutting business taxes to create jobs.
Action: Resistants are lowest among all clusters, save for the disengaged, in terms of their likelihood to take action to improve opportunities for groups. Just 44 percent say they’d be likely to get involved on behalf of poor people, 40 percent say the same for women, and a quarter for Native Americans. Rates plummet to the teens or lower for helping Asian Americans, black men and women, gays and lesbians, and undocumented immigrants.
Unlike any other cluster, of all the issues covered, resistants are most apt to say they’d get involved to improve border security (70 percent, a high among groups). In contrast, core catalysts and potential advocates are least apt to be interested in acting to secure the border with Mexico, compared with the other issues tested.
Fifty-six percent of resistants say they’d get involved to reduce poverty and 50 percent say the same about encouraging equal opportunities for all groups, while just 25 and 20 percent, respectively, are willing to get involved to improve criminal justice for minorities and provide a path to citizenship for undocumented immigrants. In each of these cases, intention to act is lower than in all other groups, save the disengaged.
When it comes to likelihood to take specific actions on behalf of issues or groups, resistants resemble ambivalents, with higher intention to act than the disengaged but lower willingness than core catalysts, potential advocates, or skeptics. A majority of resistants are willing to talk with others about their views (66 percent), sign petitions (62 percent), and/or boycott products or vendors (52 percent). Half are willing to contact elected officials (49 percent); fewer say they’d write or post something in print or online (32 percent) or take part in protests (19 percent).
Nonetheless, resistants are highest compared with other clusters in terms of their participation in some specific organizations. Thirty-two percent are active in religious groups; 20 percent are in a hobby, sports, or youth group; and 12 percent are in a school club or association. They’re also numerically more likely than other clusters to have given money to a charity (55 percent) or worked for a charity or church (33 percent) in the past year. Sixteen percent have donated blood, 15 percent attended a community meeting, and 12 percent attended a PTA meeting.
This cluster is also on the higher end of the clusters in having contacted a government official (22 percent), having worked with others to solve a community problem (12 percent), and having commented about politics on a message board or internet site (11 percent) in the past year.
Taken together, the regression and cluster analyses examined in this section provide a highly useful framework for understanding where key segments of the American public stand on opportunity issues—as well as, critically, the underlying motivations for those attitudes and preferences.
Cluster Summary
This summary table shows the alignment between the basic typologies in the cluster analysis and each group’s views and experiences. Looking at these findings, we see how each group’s attitudes, experiences, and basic orientations coalesce into the rich profiles included in the segmentation analysis.
The table below shows average scores on each variable included in the segmentation analysis. For ease of interpretation, all variables are rescaled to average 100, with cluster scores shaded when they are 10 points above or below the average.
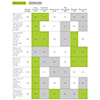
04. Very Low-income Adults, Black Men, and Others
This section addresses additional groups that may be of particular interest in terms of opportunity issues. These include very low-income adults and black men, both of whom may be especially attuned to such issues or affected by related policies, and three groups that have been particularly associated with support for such policies—nonwhites overall, unmarried women, and adult members of the millennial generation, that is, those age 18 to 29.
Very Low-income Adults
Very low-income adults—Americans with household incomes less than 50 percent of the federal poverty level, or about $12,000 for a family of four—were oversampled to allow for close examination of this relatively little-studied group. Results show that these adults are more likely than others to report having experienced discrimination, as detailed later. Given their experiences and orientations, they’re also more apt to support a range of policies intended to alleviate inequality and more willing to take action on these issues.
Demographic characteristics: Very low-income adults are distinct in a number of demographic and socioeconomic characteristics. Six in 10 are nonwhites, including 21 percent who are blacks and 31 percent who are Latinos. They are younger—by more than eight years on average—than those with higher incomes. Sixty-five percent are women, 79 percent are unmarried, and 68 percent are not employed. Just 28 percent have more than a high school diploma, compared with 60 percent of those with higher incomes.
At the same time, very low-income individuals are not found in significantly disproportionate numbers in any cluster group identified in this survey, nor are they particularly distinctive in their political orientation. They are no more likely to identify with the Democratic Party nor to call themselves liberal than are those who earn more; instead, they’re twice as likely as others to say they have no preference in political party (33 vs. 16 percent) and less apt to be Republicans.
They’re also much less likely to be registered to vote at their current address (56 percent) than those with higher incomes (79 percent) and less involved in community or civic organizations. Of the organizations and groups examined, the very poor are most apt to actively participate in religious groups and hobby, sports, or youth groups, but still just 11 and 9 percent do so, compared with 21 and 14 percent of higher-income Americans, respectively.
In the past year, 11 percent of very low-income adults have attended a PTA or school group meeting, about the same as higher-income adults. But rates of donating money to a charity (20 percent), working for a church or charity (12 percent), giving blood (7 percent), and participating in community meetings (6 percent) are roughly half or less those of higher-income adults (50, 25, 13, and 14 percent, respectively).
Fewer than one in 10 very low-income adults have contacted a government official (7 percent), worked with others in the community to solve a problem (5 percent), or commented about politics on the internet (5 percent). And even fewer have engaged in other civic behaviors in the past year.
Attitudes and experiences: Among all Americans, 39 percent say they’ve experienced unfair treatment based on their financial status, making this the most common type of discrimination measured. This jumps sharply among very low-income Americans to a majority, 56 percent.
Very low-income individuals also are more likely to say they have experienced unfair treatment because of their accent or ability in English, a result that could reflect education levels as well as the slightly higher number who predominantly speak a different language (12 percent of the very poor, compared with 5 percent of others). Indeed, very poor adults are more apt to report unfair treatment across a variety of domains: Thirty-eight percent cite three or more areas in which they have felt unfairly treated (i.e., on the basis of race, gender, sexual orientation, religion, financial situation, or English ability), compared with about half as many, 22 percent, of those with higher incomes.
Conflicted feelings may follow. On one hand, very low-income adults are 11 points less likely than other Americans to see privileges associated with their group identity, whatever it may be. On the other, the very poor also are marginally more likely than others (46 vs. 37 percent) to say it’s at least somewhat acceptable for some groups to have more opportunities than others. That seemingly counterintuitive attitude is anticipated by the social psychology literature, which suggests that disadvantaged groups seek to justify discrimination rather than confronting the possibility of systemic injustice.
A sense of being disadvantaged might be higher among the very poor if their financial status were a main element of their social identity. However, fewer than half, 46 percent, cite their “financial situation or economic class” as important to their self-identity. (For comparison, three-quarters of black men cite their race as important to their identity.) Indeed, very low-income individuals are at least as apt to rate a range of attributes beyond their financial status as important to who they are—including their gender (58 percent), religious beliefs (50 percent), race (49 percent), and ethnicity (48 percent).
This group’s less-than-overwhelming identification with their economic class does not reflect a general lack of recognition of their financial condition. Eighty-six percent identify themselves as less than middle income, nearly twice as many as in the rest of the adult population. Still, fewer than a third—29 percent—describe themselves as “poor” (compared with 6 percent of those with higher incomes), perhaps given the pejorative nature of the word, or relative comparisons.
Basic orientations: There are few differences between very low-income adults and those with higher incomes in terms of basic values. Although the former are less likely to say “acting honorably” is the most important value to them, they generally share the broader population’s views across a range of values and orientations. Rather, it seems that the key features that distinguish this group from the more affluent center on their experiences with unfair treatment.
Policy preferences: Americans with incomes less than 50 percent of the federal poverty level show much greater support for increasing federal funding for several anti-poverty programs, including food stamps (58 percent, compared with 30 percent among those with higher incomes), school lunch programs (55 vs. 43 percent), and unemployment benefits (47 vs. 27 percent). They also are more likely to favor raising the minimum wage and expanding tax breaks to encourage affordable housing by 13 and 11 points, respectively.
Very poor adults are slightly more likely than others to think that they personally, and the poor in general, have the ability to change things for the better. In addition to that sense of efficacy, the very poor express higher levels of willingness to take action in support of a range of specific groups. They’re more likely than higher-income adults to express interest in acting in support of people who have served a prison sentence, undocumented immigrants, black men, minorities in the criminal justice system, black women, and Latinos, by 12 to 15 points.
Echoing their current lack of civic involvement, very low-income adults indicate somewhat less intention to take specific actions (or say they already do) compared with higher-income adults. They’re most apt to be willing to talk with others about their views (59 percent) or to sign a petition (56 percent), but even these intentions are somewhat lower than among higher earners.
Fewer than half in this group say they’d write or post something (45 percent), boycott products or vendors (44 percent), volunteer or donate money (43 percent each), participate in creative projects to bring attention to a cause (42 percent), contact an elected official (40 percent), or take part in a protest or march (36 percent).
While in most cases these intentions to take action are at least numerically lower than they are among higher-income earners, there are exceptions. Very low-income Americans express a greater willingness to take part in the three most public and active of the civic behaviors tested—writing or posting something (45 vs. 36 percent), participating in an artistic project (42 vs. 34 percent), and taking part in a protest or march (36 vs. 27 percent).
Compared with others, very low-income Americans have higher levels of personal and group efficacy and more experience of unfair treatment—all of which predict higher likelihood of being willing to take action. This, together with their support of policies to address poverty, makes very low-income individuals a group, like core catalysts, that—with encouragement—may be particularly open to taking an active role in opportunity issues.
Black Men
The Opportunity Survey also oversampled black men for separate analysis, finding substantial ways in which they differ from most others in terms of their experiences, preferences, and attitudes on equal-opportunity issues and policies.
Notably, black men, like the very poor, are more likely than others to have experienced unfair treatment—six in 10 because of their economic class and 77 percent because of their race. Black men also are more apt to perceive limits on opportunity in society more generally (more than half, 55 percent, feel society offers opportunities to only some or just a few groups) and to attribute unequal treatment to social conditions rather than to group behavior.
Black men also have a greater-than-average preference for equality, are more likely to see unequal treatment of groups as problematic, and are less likely to see intrinsic differences in aptitude among groups. They are more apt than others to have incorporated their race and economic class as key aspects of their identity and much more likely to support policies to alleviate poverty and address inequality. They’re also more likely to express willingness to take action on behalf of disadvantaged groups.
In most of the views, experiences, and values examined in this study, black men and black women are quite similar. What differences exist primarily relate to gender inequality but also appear on issues concerning gays and lesbians. The similarities between these two groups far outnumber these few differences; race, not gender, is by and large the driving factor.
Demographic characteristics: Many of the characteristics that describe black men also are features of core catalysts, the cluster most attuned to recognizing inequality and most willing to act to address it. Indeed, nearly half of black men (45 percent) are core catalysts; they account for 12 percent of the cluster, compared with just 4 percent of all other adults.
In some socioeconomic terms, black men are less likely than other adults to own their home (51 vs. 70 percent) or to be employed (47 vs. 58 percent). They’re also less apt to be married (39 vs. 55 percent).
Like core catalysts, most black men identify with the Democratic Party (67 percent, compared with one-third of others). But they are not significantly more likely to identify themselves as liberal (37 vs. 31 percent). Economically, most (63 percent) earn less than $50,000 a year, compared with 40 percent of all others. And two-thirds describe themselves as less than middle income, compared with 47 percent of others.
Attitudes and experiences: As noted, 77 percent of black men say they have been treated unfairly because of their race or ethnicity; that compares with just 29 percent of all other adults (but is similar among black women). Further, this measure is based on unfair treatment that has occurred often or sometimes; it’s 91 percent among black men when the definition is expanded to any such occurrence, no matter how frequent.
Race is not the only attribute on which black men are more likely than others to report discrimination. Sixty percent say they frequently have been treated unfairly because of their economic class; among all others, just 38 percent say so. Black men are especially likely to report having been treated unfairly due to multiple attributes. Counting across the six group memberships tested, 38 percent of black men say they have faced unfair treatment because of at least three of them, compared with 22 percent of other adults. (Again, black women resemble black men in these experiences.)
Given their experiences, just two in 10 black men feel that things are better for the group they identify with most closely compared with other groups. That’s less than half the level of self-perceived group advantage that other adults report (42 percent).
Black men also are much more likely than others to say blacks experience discrimination in housing (61 vs. 36 percent) and, it follows, to feel that laws designed to prevent discrimination in housing are too weak. While they’re more likely to rate unequal treatment of their group as a problem (79 percent say it’s serious, compared with 56 percent of other adults) black men also are more likely to say the same about unequal treatment of other groups, including Latinos, poor people, individuals who have served a prison sentence, black women, women overall, and undocumented immigrants.
In another wide gap, 64 percent of black men blame inequality that affects their group on social conditions rather than group behavior. Among other Americans, far fewer, 36 percent, attribute discrimination against black men to social conditions. Again, more than in-group sensitivity is involved; black men also are more apt than others to see social conditions as the cause of inequality faced by a range of groups—black women (67 vs. 45 percent), poor people (64 vs. 49 percent), Native Americans (68 vs. 56 percent), Latinos (61 vs. 42 percent), undocumented immigrants (51 vs. 35 percent), and those who have served a prison sentence (35 vs. 20 percent).
As noted, black women’s experiences of unfair treatment are similar to black men’s. So are their views of the relative standing of the group they identify with most strongly compared with other groups and their attribution of group inequality to social conditions. Further, black women are even more apt than black men to see unequal treatment of various groups as a serious problem.
Basic orientations: An individual’s identity often is based, at least to some degree, on the sociodemographic groups to which he or she belongs, particularly if those groups are socially disadvantaged. Indeed, 75 percent of black men say their race is an important aspect of their identity and 78 percent of black women say the same, while this declines to 42 percent of non-blacks. Forty-seven percent of black men call their race “essential” to their identity, as do 57 percent of black women, compared with only 21 percent of non-blacks.
Black men also are 27 points more likely than others to say that their ethnicity is an important part of their identity and 11 points more likely to say the same about their financial situation. If anything, these differences are even broader among black women, 34 and 23 points, respectively.
Fairness ranks high among black men: Forty-one percent rate “treating everyone equally” as the single most important of five values tested in this study; by contrast, it’s ranked first by 26 percent of others.
In addition, nearly all of the black men surveyed (92 percent) say they feel society works better when all groups have an equal chance in life, with three-quarters saying they feel this way strongly, 18 points more than among other adults. And black men are 11 points more likely than others to see it as unacceptable for some groups to have more opportunities than others.
Many see such opportunities as limited. Similar to core catalysts overall, 55 percent of black men say that society offers equal opportunities for only a limited number of groups. Among other adults this view drops sharply, to 38 percent.
Black women also share a preference for fairness, with nearly half of the group (47 percent) ranking equal treatment as the most important value. They also are similar to black men in their preferences for equal chances and their perceptions of the opportunities available in society.
Policy preferences: Overall, black men are more apt than average to support a number of policy proposals meant to address unequal opportunity. Those include stronger support for expanding tax breaks to encourage affordable housing, increasing the minimum wage, and expanding job training programs.
Black men and Americans in general have similarly negative views of the criminal justice system. However, there are differences in opinions on related policies. Just 38 percent of black men prioritize stricter punishment over rehabilitation for those convicted of crimes. Among other adults, this jumps to 54 percent. And black men are more likely to support the legalization of marijuana than are other adults.
As noted, black men are particularly apt to say they are likely to take action (or already are doing so) to help several groups—other black men, black women, people who have served a prison sentence, Latinos, undocumented immigrants, Asian Americans, and Native Americans. Across these groups, black men are between 17 and 43 points more likely to express willingness to act.
Black men also are more apt to be willing to take action (or already do) in support of issues, including ensuring fair treatment for minorities in the criminal justice system, creating a path to citizenship, encouraging equal opportunity in general, and reducing poverty in the United States.
In terms of willingness to engage in specific behaviors, black men express about the same intentions as adults overall except in two cases. Forty-four percent of black men say they’d be willing to (or already do) participate in creative projects that bring attention to an issue and 37 percent say they’d take part in a protest, march, or demonstration. Both are 10 points higher than the general population’s willingness to take these actions.
Black men’s current involvement in the community essentially matches that of others in terms of active participation in organizations, recent community involvement, and civic engagement. The only exception is that black men are 13 points less likely than others to have donated money in the past year (36 vs. 49 percent), likely a reflection of their relatively lower income.
Nonwhites, Unmarried Women, and Millennials
Among other groups of interest are three that have been closely followed for their impact on elections—nonwhites, unmarried women, and millennials (adults younger than 30). On the attitudes and experiences studied in this survey, nonwhites and unmarried women have much in common; millennials, less so.
Nonwhites and unmarried women
Nonwhites and unmarried women are disproportionately likely to be found among core catalysts. As is typical for those in this cluster, both groups are more likely than others to have experienced unfair treatment, to see it as a serious problem, and to express willingness to take action on behalf of various groups and social issues. Politically, nonwhites and unmarried women are disproportionately likely to identify themselves as Democrats and as liberals.
Both groups report having experienced more unfair treatment than others—nonwhites chiefly on the basis of their race or ethnicity (60 percent), unmarried women because of their gender (48 percent), and both for their economic situation (49 percent for both groups). Nonwhites also are more likely than others to experience unfair treatment due to their accent or fluency in English.
Nonwhites and unmarried women are more apt to say unequal treatment is a serious problem, in both cases for nearly all groups asked about in the survey. Greater percentages of nonwhites and unmarried women say they would be likely to take action on behalf of various groups and issues alike.
There are some key differences between these groups, with nonwhites more likely than unmarried women to see inequality as worse for society, to support social policies to address it, and to feel they can have an impact. As a result, nonwhites are somewhat more likely to be found among core catalysts. However, in measures of engagement, nonwhites are less apt than others to report being registered to vote, having voted in 2012, and being active in community groups.
Nonwhites and unmarried women are more likely than others to rank equal treatment as the most important value to them; nonwhites, additionally, are more likely to feel strongly that society works better when all groups are treated equally.
On policies, both groups are more likely than the overall population to support increasing the minimum wage. Sixty-six percent of nonwhites and 60 percent of unmarried women highly prioritize this as a means of reducing poverty, compared with 52 percent overall. Nonwhites and unmarried women also tend to be more supportive than the general population of increasing federal funding for unemployment benefits, school lunch programs, food stamps, and college loans for low-income students, as well as to think tax breaks to encourage affordable housing should be expanded.
Nonwhites are more likely to emphasize the importance of expanding job training (59 percent do, compared with 45 percent of the population overall) and reducing business taxes (narrowly, 48 percent vs. 43 percent overall), while unmarried women are not. On other anti-poverty policies (e.g., improving public education and avoiding cuts to social security), nonwhites and unmarried women look much the same as the population overall.
Nonwhites are more supportive of policies to help formerly incarcerated individuals get a job and undocumented immigrants find a pathway to citizenship, but views of alternative sentencing and racial profiling roughly match the overall population. Unmarried women’s views tend not to differ much from the overall population’s on these policies.
As noted, both groups are more willing to take action to improve group opportunities than the general population. Among nonwhites, willingness to engage in action to improve opportunities for Latinos (65 percent are willing to act or already do), black women (64 percent), black men (59 percent), undocumented immigrants, and Asian Americans (both 53 percent) is particularly high compared with willingness among adults overall. Among unmarried women, willingness to take action on behalf of women (77 percent) and gays and lesbians (51 percent) is notably higher compared with the general population (58 and 34 percent, respectively).
On issues, nonwhites and unmarried women are more likely than the general population to be willing to take action (or to be already doing so) to support fair treatment of minorities in the justice system, a path to citizenship, reducing poverty, and encouraging equal opportunity overall. The gap between nonwhites and the general population is especially large on two issues: fair treatment of minorities in the justice system (69 percent of nonwhites are willing to act to support this vs. 48 percent overall) and a pathway to citizenship (60 vs. 40 percent).
Similar to black men, nonwhites and unmarried women express significantly greater willingness to get involved in artistic projects to bring attention to a cause and to take part in a protest or march. Other differences in behavioral intentions are smaller but generally show a greater willingness on the part of nonwhites and unmarried women to engage on the issues than is found in the general population.
Millennials
Young adults—or millennials—often are viewed as a distinctive group in terms of their interests, experiences and policy preferences. In terms of this study, however, more often than not their values, attitudes, experiences, and behaviors surrounding equality of opportunity match those of older adults. There are a few notable, if not always consistent, exceptions.
One exception, as noted, is that millennials are somewhat more apt to be found among core catalysts and skeptics, 24 and 25 percent, respectively, than among other clusters. Millennials also are more likely than others to say that treating everyone equally is the most important value to them (38 percent) and that society offers opportunities only to some people (45 percent).
At the same time, young adults also are more tolerant of inequality among groups (fewer have a strong preference for equality) and are more accepting of one group having more opportunities than others. Just half of millennials feel strongly that society functions better when all groups have an equal chance in life, and 54 percent feel it is unacceptable for there to be differing opportunities among groups in society—significantly fewer than the share of older adults (nearly two-thirds) who feel the same.
In another difference, millennials stand out in their levels of personal and group efficacy. Those under age 30 are 13 points more likely than others to feel they have the ability to change things on issues that are important to them. They’re also more likely than others to see the poor and undocumented immigrants as able to change things for the better.
Still, millennials are no more likely than others to say they’re willing to take action in support of a group or an issue, with two notable exceptions: Forty-five percent are willing to take action (or already do) to improve opportunities for gays and lesbians, and 38 percent say the same of undocumented immigrants. Those are higher in both cases than among older adults, 36 and 29 percent, respectively.
Millennials’ willingness to take specific actions to support a group or a cause also is generally similar to those of older adults, with three exceptions. Millennials are less likely to be willing to contact an elected official (just 37 percent say they’d do this or already have) but are more likely to be willing to participate in artistic projects (43 percent) and to take part in a protest or march (34 percent).
Millennials are 17 points less likely than others to report being registered to vote and, among those who were old enough to do so, 15 points less apt to say they voted in 2012. They’re more likely than others to have no preference in political parties, as well as to identify themselves as liberals.
Not surprisingly given their relative youth, current community engagement among millennials also is lower than among older adults, with the exception of membership in a sports team or youth group (17 percent) or school club or organization (13 percent).
Among the other organizations tested, millennials are most apt to belong to a religious group, with 15 percent currently a member, but that still trails older adults’ participation rate (22 percent). Fewer than 5 percent of millennials say they actively participate in any of the other organizations tested.
Millennials also are less likely than older adults to say that in the past year they’ve given money to a charity (25 percent), worked for a charity (16 percent), or attended a PTA or community meeting (9 percent each). However, they’re as likely as older Americans to have donated blood (13 percent), to have commented about politics on the internet (7 percent), and to have worked with others in their community to solve a problem (6 percent). Very few millennials (less than 5 percent) say they’ve recently done any of the other civic behaviors tested.
Conclusions
Americans’ attitudes on social policy issues are well-measured on an ongoing basis by a range of publicly released opinion polls. What’s been less closely evaluated are the roots of these views, grounded in core values, understanding of how society works, preferences for how it should work, personal experiences with discrimination, and familiarity with other groups.
Measuring these bases of attitude formation and assessing their relative influence is key to a deeper understanding of Americans’ perceptions of opportunity in U.S. society, their views on related policies, and their propensity to act on behalf of various issues and groups alike.
The Opportunity Survey’s examination of this subject is informed by the rich literature on psychological orientations, and a review of Appendix A, which summarizes this foundational work, is recommended. In addition to drawing on previous research, this study subjects relevant concepts to representative, random-sample survey research methods and robust statistical modeling.
Attitudes on the issues covered in this survey often are examined in a simplified manner—for example, as liberal vs. conservative or Republican vs. Democratic. Those constructs leave little room for a broader framework based instead on the core values that shape political preferences.
Pre-political values and views of the structure of society reside at the heart of people’s identities. As such, these orientations are highly resistant to change. Rather than challenging basic values or exacerbating differences among them, results of the Opportunity Survey can be used, instead, to draw connections between those values and the issues and policies of interest.
One example would be to think of equal opportunity as a deeply traditional American precept from which individual initiative then flows. Another would be to explore the extent to which discrimination exists and its impacts. A third would be to cultivate greater cross-group connections, which have been shown to foster awareness and sensitivity to opportunity issues.
Other perceptions may be less resistant to change but are no less important in shaping views of social issues. For example, feelings of efficacy—that one has the ability to improve things for the better on important issues—are fairly low even in the most action-oriented groups. Giving individuals tools and confidence to feel they can have an impact can go a long way in motivating action. Likewise, emphasizing the ways in which individual success and broader societal success are linked may help to foster greater support for social programs.
Further, efforts to work with these attitudes need to take into account different values, orientations, and experiences across population groups. Advocates for or against any of a range of policies would do best to employ substantially different communication strategies depending on whether their audience consists primarily of core catalysts, potential advocates, ambivalents, the disengaged, skeptics, or resistants.
By evaluating the interplay of basic orientations with experiences and issue preferences, this study provides essential insight into how Americans see themselves and their society and how those views in turn inform attitudes on inequality and its remedies. Reaching beyond customary dichotomies, the results suggest pathways to common ground on opportunity in the United States.